CATEGORY
West Australia Electricity
The report covers in detail the market supply demand dynamics, supplier landscape, pricing analysis and procurement best practices across the industries for Australia Electricity
Beroe LiVE.Ai™
AI-powered self-service platform for all your sourcing decision needs across 1,200+ categories like West Australia Electricity.
Market Data, Sourcing & Supplier Intelligence, and Price & Cost Benchmarking.
Schedule a DemoThe World’s first Digital Market Analyst
Abi, the AI-powered digital assistant brings together data, insights, and intelligence for faster answers to sourcing questions
Abi is now supercharged with GPT4 AI engine. Enjoy the ease of ChatGPT, now on Abi
West Australia Electricity Suppliers

Find the right-fit west australia electricity supplier for your specific business needs and filter by location, industry, category, revenue, certifications, and more on Beroe LiVE.Ai™.
Schedule a Demo


Use the West Australia Electricity market, supplier and price information for category strategy creation and Quaterly Business Reviews (QRBs)
Schedule a DemoWest Australia Electricity market report transcript
West Australia Electricity Industry Structure and Outlook
-
Global power generation is expected to grow at approx. 0.5-1.5 percent CAGR through 2019-2025
-
The APAC region, the largest consumers of electricity, would be the pivotal point for this growth amid covid induced pandemic
-
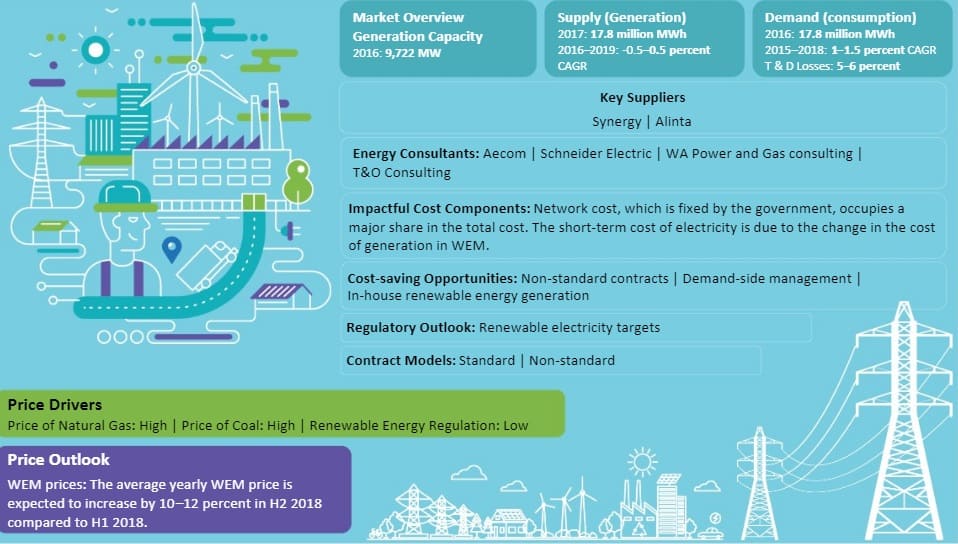
Total generation capacity in Western Australia is 5,812 MW in 2022. Electricity generation is expected to be 17.72 TWh in 2022 with a CAGR of 0.5 percent. The renewable generation share was 33 percent in February 2023. Western Australia is expected to have a milder growth rate of about CAGR 0.5 percent, while the growth in supply is expected to match the demand growth in the region

Industry Structure and Outlook
Capacity
Capacity degrowth is expected to happen at the same rate, as the demand from the region is expected to slow down
-
Grid electricity demand in the region is decreasing over the years as the roof top installations have been growing
-
Solar PV installations have been growing in Western Australia and increased to 2500 MW, which in turn has reduced the load on the grid
-
Decrease in domestic natural gas prices might have impacted the cost of generation and is expected to ease as the proposed export restriction come into force
-
The Reserve Capacity Requirement, which is somewhat lower than the 4,421 MW requirement in 2022–2023, has been assessed to be 4,396 megawatts (MW) for 2023–2024 in order to satisfy predicted peak demand
Fuel Mix
-
In 2022, Coal, natural gas, and renewable are the three major components of the West Australian fuel mix, with natural gas and coal accounting for 37 percent and 27 percent of the total electricity generated, respectively. The average renewable contribution has increased significantly in the last year to more than 30 percent in 2022.
-
To compensate for the decrease in coal generation due to outages, gas-fired generation increased by an average of 213 MW (+35 percent), with gas supplying 37.4 percent of underlying demand on average, making it the primary fuel type throughout the fourth quarter of 2022. However, due to high price and supply issues, the Government is trying to reduce the dependency on natural gas contribution to the fuel mix.
-
For qualified Emissions Reduction Fund (ERF) projects, a pilot program offers an advance payment of up to $5,000 to aid with the up-front costs of soil surveys has been initialized by the Australian government for the improvement of sustainable alternative
Generation and Consumption Profile
-
Over 1.1 million Western Australian households are served by the Southwest Interconnected System (SWIS), which is linked to the Wholesale Electricity Market (WEM)
-
Electricity demand has decreased by around 1.5 percent in 2021 compared to 2020 whereas there is a decline of 0.2 percent in demand in 2022. The demand is expected to increase by 0.5 to 2 percent in the coming months. The quarterly average operational demand in the Wholesale Electricity Market (WEM) was 1,723 MW, a 7.4 percent decrease from Q4 2021 and the lowest quarterly average since Q3 2006. The main drivers were mild temperatures and an increase in distributed PV generation.
-
Quarterly average coal-fired generation fell to an all-time low of 438 MW in Q4 2022, 42 percent lower than in Q4 2021. This was primarily due to a reduction in facility availability due to coal preservation and ensuring adequate summer inventories.
-
One in three homes in the SWIS have rooftop solar panels, making it the major generator there. By 2030, commercial and residential solar power is anticipated to have 4,069 MW of installed capacity or about 45 percent of all anticipated generation capacity.
Electricity Suppliers Market Landscape
-
There are 28 electricity generating companies in SWIS, with a total capacity of 6015.5 MW
-
Synergy, which is a government organization, dominates the electricity generation sector, with 44 percent of the capacity in WEM
-
Alinta Energy and Bluewater have a capacity share of 18 percent and 7 percent, respectively, making them the next highest generators in the SWIS region
Interesting Reads:
Discover the world of market intelligence and how it can elevate your business strategies.
Learn more about how market intelligence can enable informed decision-making, help identify growth opportunities, manage risks, and shape your business's strategic direction.
Get Ahead with AI-Enabled Market Insights Schedule a Demo Now
