CATEGORY
Coal
Coal is the largely used source for power generation over the years and 10.2 GW of electricity in 2021 .Coal is highly driven by the supply-demand balance in the region. The ease in COVID restrictions, tight supply conditions, and current Ukraine–Russia tension would impact the coal cost on a short-term basis
Beroe LiVE.Ai™
AI-powered self-service platform for all your sourcing decision needs across 1,200+ categories like Coal.
Market Data, Sourcing & Supplier Intelligence, and Price & Cost Benchmarking.
Schedule a DemoCoal Market Monitoring Dashboard
Understand the correlation between costs, margins, and prices impacting your category on a real time basis on Beroe LiVE.Ai™
Schedule a DemoThe World’s first Digital Market Analyst
Abi, the AI-powered digital assistant brings together data, insights, and intelligence for faster answers to sourcing questions
Abi is now supercharged with GPT4 AI engine. Enjoy the ease of ChatGPT, now on Abi
Coal Suppliers
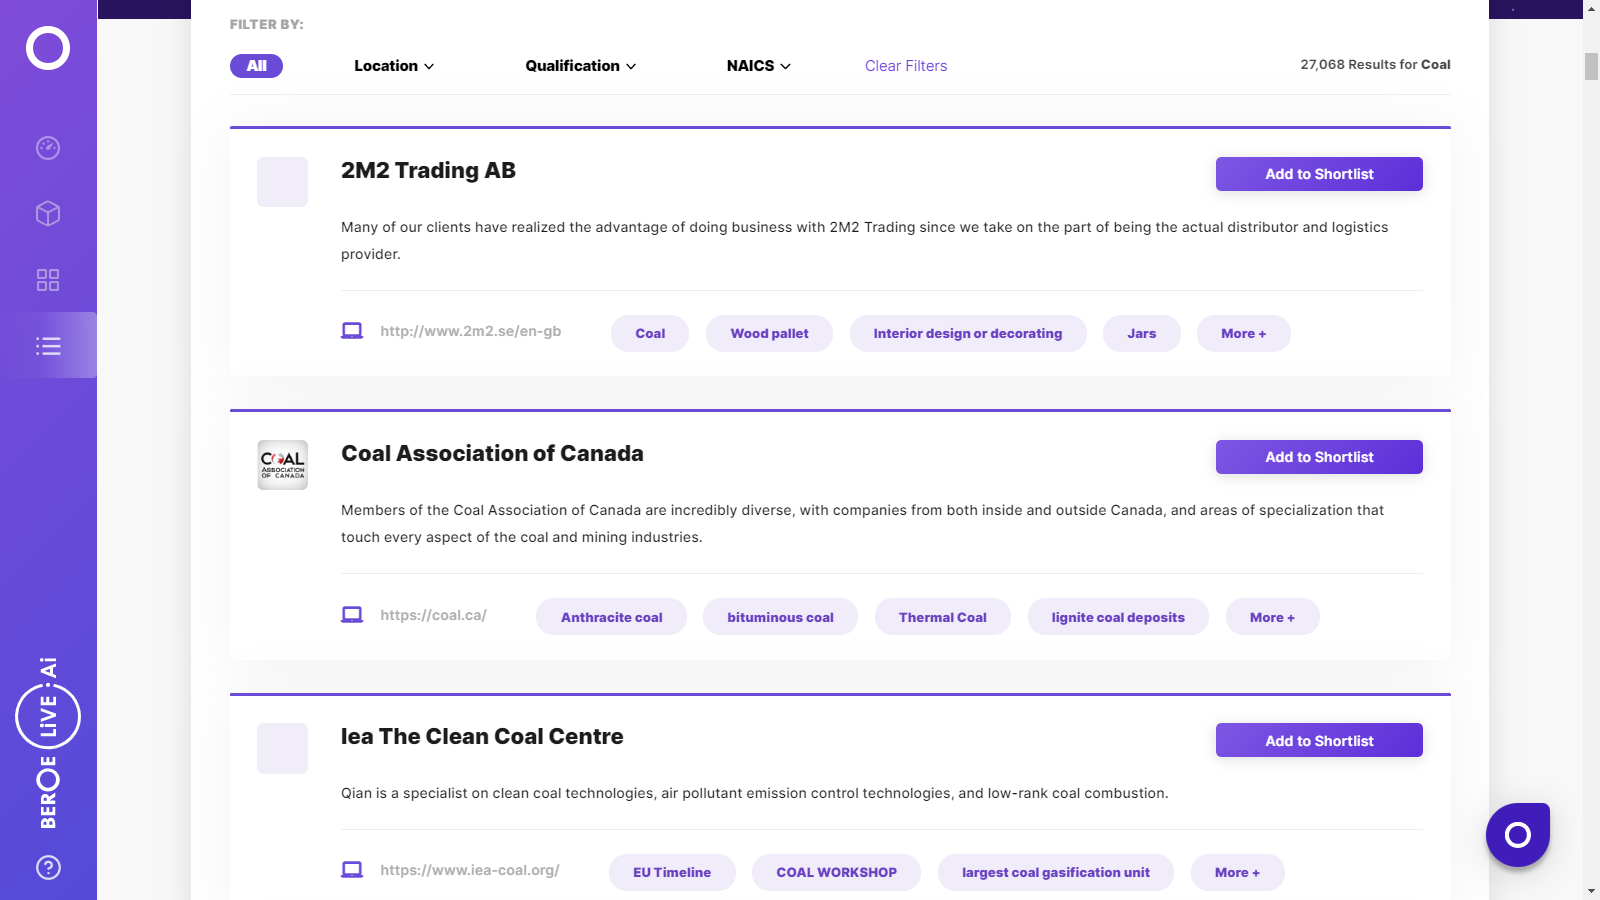
Find the right-fit coal supplier for your specific business needs and filter by location, industry, category, revenue, certifications, and more on Beroe LiVE.Ai™.
Schedule a Demo

Use the Coal market, supplier and price information for category strategy creation and Quaterly Business Reviews (QRBs)
Schedule a DemoCoal market report transcript
Coal Global Market Outlook
-
The global demand for coal in 2021* was estimated to be 160.10 exajoules. It is expected to grow in 2022 because of ongoing geopolitical events, despite its emission issues
-
Due to the COVID-19 pandemic's effect, the overall coal demand increased by 6.3 percent in 2021 after falling by 4.4 percent in 2020 to 151 exajoules
Industry Structure and Outlook
Global Supply and Demand
-
The total coal demand has increased by 6.3 percent in 2021 after a 4.4 percent drop in 2020 to 151 exajoules, due to the impact of the COVID-19 pandemic
-
The total coal production has reached the record-breaking highest level, with 5.9 percent growth in 2021 at 167.58 exajoules
-
APAC is a major producer and consumer of coal globally
-
The industrial sector leads the sector-wise consumption with 32.5 exajoules, followed by the commercial sector and non-energy use with 2.5 and 2.1 exajoules, respectively
Porter’s Five Forces Analysis: Coal
-
Suppliers have an upper hand in the coal market, owing to the limited presence and barriers for new suppliers to enter the market.
-
Buyer power is limited, due to the limited options available to fulfil demand obligations.
Supplier Power
-
The supplier power in the global coal market is relatively high, due to the geographical constraints in production
-
Only limited suppliers own coal productions
-
Tight regulations and higher CAPEX reduce competition, and thereby, increases supplier power for existing players
Buyer Power
-
Buyer power is medium, as it varies from region to region
-
Strong demand from power plants located near to coal mines has higher buyer power over the supplier
-
On a global scale, buyer power is medium, as the coal-based generation demand is not easily replaceable from other commodities. Hence, buyers usually have lower power over suppliers, due to demand obligations
Barriers to New Entrants
-
Barriers to the new entrants are high in the coal market, owing to the stringent environmental and emission policies in mining
-
The high capital and logistical challenges too reduce the attractiveness for new players
Intensity of Rivalry
-
Intensity of rivalry is usually low, as the competition is limited and existing buyers have long-term sourcing contracts with limited sports purchases and trades
-
With less number of operators functioning in a particular region, competition at the production is limited as well
Threat of Substitutes
-
Threat of substitution is relatively higher, as the current policies do not favor coal-based energy, due to the associated emissions
-
Although direct substitution is possible from biomass, which is limited on a global scale, increased natural gas and renewable energy generation capacities pose a significant threat to coal demand
Interesting Reads:
Discover the world of market intelligence and how it can elevate your business strategies.
Learn more about how market intelligence can enable informed decision-making, help identify growth opportunities, manage risks, and shape your business's strategic direction.
Get Ahead with AI-Enabled Market Insights Schedule a Demo Now