CATEGORY
Electricity Market Australia
Beroe LiVE.Ai™
AI-powered self-service platform for all your sourcing decision needs across 1,200+ categories like Electricity Market Australia.
Market Data, Sourcing & Supplier Intelligence, and Price & Cost Benchmarking.
Schedule a DemoThe World’s first Digital Market Analyst
Abi, the AI-powered digital assistant brings together data, insights, and intelligence for faster answers to sourcing questions
Abi is now supercharged with GPT4 AI engine. Enjoy the ease of ChatGPT, now on Abi
Electricity Market Australia Suppliers

Find the right-fit electricity market australia supplier for your specific business needs and filter by location, industry, category, revenue, certifications, and more on Beroe LiVE.Ai™.
Schedule a Demo


Use the Electricity Market Australia market, supplier and price information for category strategy creation and Quaterly Business Reviews (QRBs)
Schedule a DemoElectricity Market Australia market report transcript
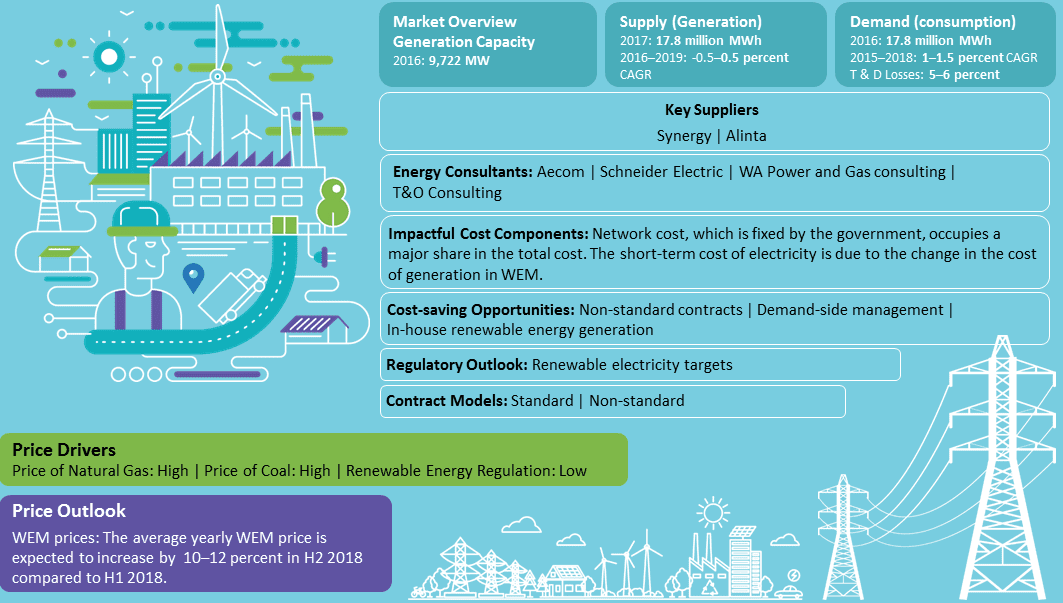
Regional Market Outlook on Energy Market in Australia
-
The average prices of Australia declined in 2022, but as the summer seasonal demand is again on the lower side, the prices are expected to decline for Q1 2023
-
As a part of plans to become a renewables superpower and meet the needs of South Asian nations, Australia has committed in reducing greenhouse gas (GHG) emissions by 43 percent and increasing the share of renewable power generation in the nation's National Electricity Market to 82 percent by 2030
-
There is overall lowered demand in the international market and also the domestic market, due to lowered heating demand and seasonal changes

Market Outlook
-
New minimum operational demand records were seen in New South Wales (down 211 MW on the previous minimum set in 1999), Victoria (down 196 MW), and South Australia (down 132 MW), while minimum operational demand for the NEM as a whole fell to a record low of 12,936 MW, down 1,257 MW on the prior low set in Q1 2022
-
The gap between higher average electricity prices in the mainland NEM’s northern regions (Queensland and New South Wales) and those in the southern regions remained pronounced at $45/MWh for the quarter, having first opened in Q2 the previous year
Industry Structure and Outlook
Renewable Energy Scenario Australia
-
For Australia, the renewable energy generation share is the highest from wind power at 34.29 percent of the total renewable energy generation, followed by hydro at 30.50 percent, solar at 28.40 percent, and so on
-
Australia is expected to meet 40 percent of its total electricity generation from renewable sources in 2022
-
By 2030, Australia wants to phase out the production of electricity from coal and gas-fired power plants
-
Dry conditions and comparatively lower hydro output have lowered hydro generator’s output
-
Adoption of solar and battery storage is expected to increase in the future. Rooftop solar is not included in the graph, as it is not connected to the grid
-
According to GlobalData, the nation wants to export renewable energy, and it has begun negotiations with Singapore for an interconnection line. 15 percent of Singapore's electricity needs are anticipated to be met by renewable electricity exports from Australia
Porter's Five Forces Analysis
-
The Australian electricity market is divided into generation, T&D sector, where the generation sector has both private and public players.
-
Large buyers have an option to avail the services from any of the supplier for procuring electricity
Supplier Power
-
Australia has abundant coal and natural gas resources, which is a major fuel used in electricity generation
-
Due to the monopoly of suppliers and abundant availability of resources, supplier power is high
Barriers to New Entrants
-
High capital expenditure for establishing an utility company
-
West Australia has enough generation, T&D capacity than its current consumption. So, the existing players can easily satisfy any growing demand
-
Any new entrant needs to acquire customers of other companies
Intensity of Rivalry
-
65 percent of the total electricity consumed is generated by top two retailers in West Australia, with Synergy supplying ~50 percent of electricity consumed
-
The market is concentrated in nature, hence rivalry among the market players is less
Threat of Substitutes
-
West Australia is heavily dependent on coal for its electricity generation
-
It has enough natural gas capacity to gradually substitute coal-based generation to meet clean energy requirements
-
The threat, due to unavailability of raw material, in case of regulatory change, is low
Buyer Power
-
A large consumer of electricity can choose an electricity retailer, the choice is limited to seven retailers
-
This limits the buyer power in the market
Why You Should Buy This Report
- Information on the energy market Australia, structure, outlook, value chain, supply-demand, energy market analysis, key regulations, and policies, and other energy market intelligence.
- Porter’s five forces analysis of the energy market Australia
- Supplier landscape, profiles and SWOT analysis of key players like Alinta, etc.
- Cost structure analysis, cost breakup, contract models, pricing analysis, etc.
- Price trend and forecast, price drivers, cost comparison, etc.
- Sourcing practices, supplier switching, etc.
Interesting Reads:
Discover the world of market intelligence and how it can elevate your business strategies.
Learn more about how market intelligence can enable informed decision-making, help identify growth opportunities, manage risks, and shape your business's strategic direction.
Get Ahead with AI-Enabled Market Insights Schedule a Demo Now
