CATEGORY
Carbon Footprint Reduction Measures
The report covers in detail the market supply demand dynamics and supplier landscape across the industries for EMEA Carbon Market
Beroe LiVE.Ai™
AI-powered self-service platform for all your sourcing decision needs across 1,200+ categories like Carbon Footprint Reduction Measures.
Market Data, Sourcing & Supplier Intelligence, and Price & Cost Benchmarking.
Schedule a DemoThe World’s first Digital Market Analyst
Abi, the AI-powered digital assistant brings together data, insights, and intelligence for faster answers to sourcing questions
Abi is now supercharged with GPT4 AI engine. Enjoy the ease of ChatGPT, now on Abi
Carbon Footprint Reduction Measures Suppliers

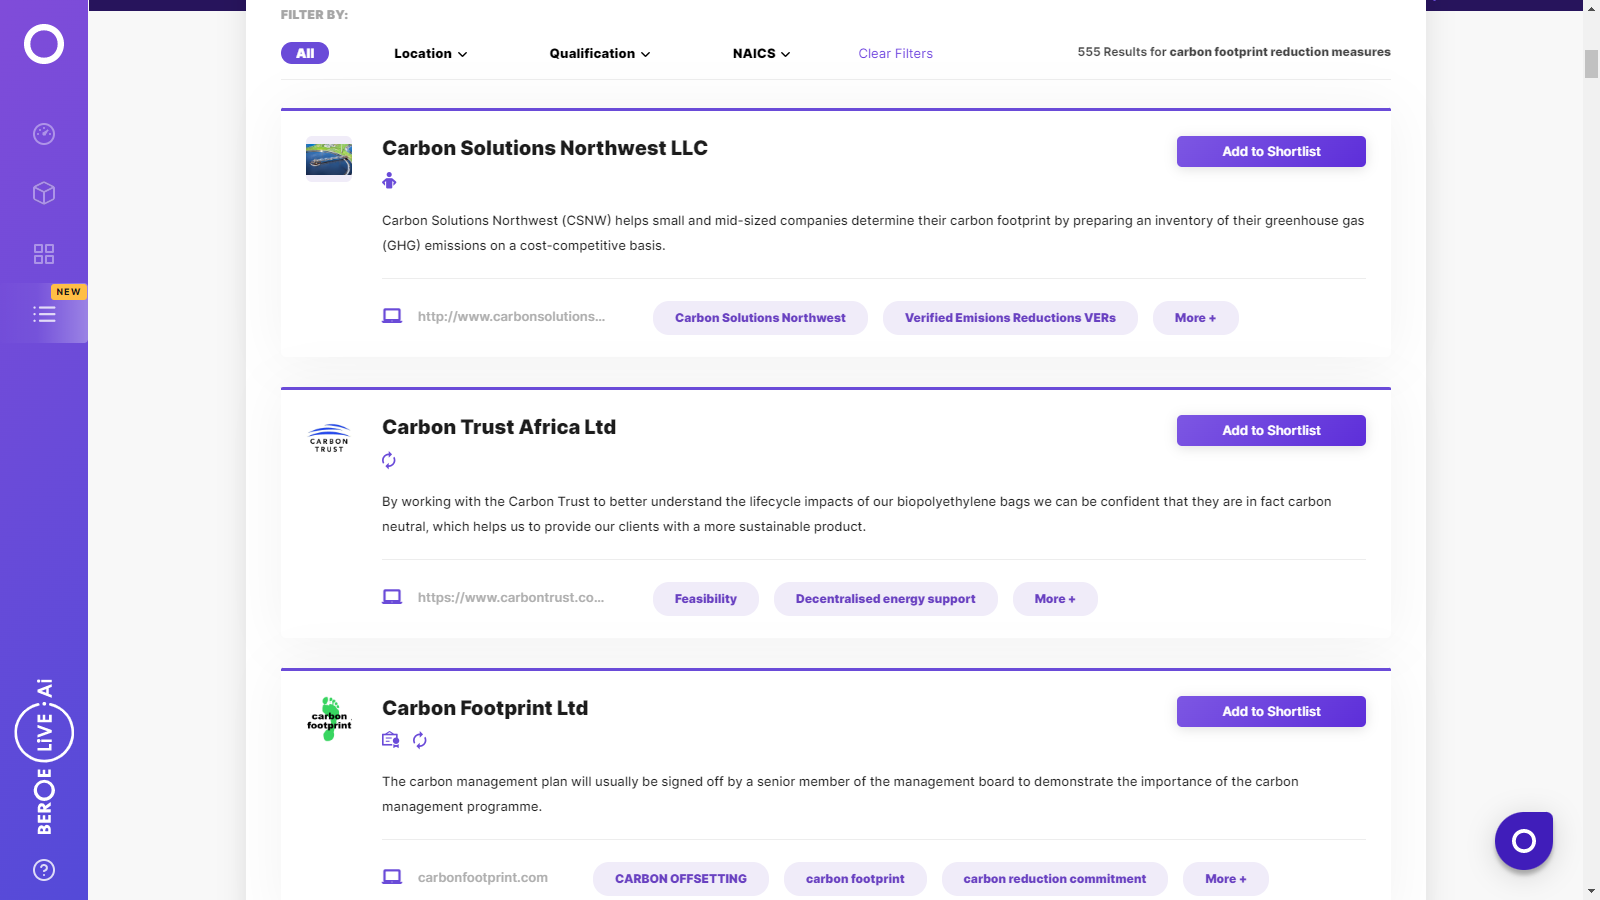
Find the right-fit carbon footprint reduction measures supplier for your specific business needs and filter by location, industry, category, revenue, certifications, and more on Beroe LiVE.Ai™.
Schedule a Demo


Use the Carbon Footprint Reduction Measures market, supplier and price information for category strategy creation and Quaterly Business Reviews (QRBs)
Schedule a DemoCarbon Footprint Reduction Measures market report transcript
Global Market Outlook on Carbon Footprint Reduction Measures
Carbon trading mechanisms have developed due to a global need to reduce carbon emissions and these are the compliance markets with high prices. EU-ETS is the biggest global trading scheme, and new schemes are scheduled or being considered due to the effectiveness of EU-ETS.
Overview of the Carbon Trading Mechanisms relevant to industry countries
- Carbon trading mechanism are regulatory and mandatory instruments utilized by national agencies to decline carbon emissions from industries that are emission intensive. The mechanism was created post the Kyoto protocol to decline the greenhouse gas emissions.
- Globally, the various trading mechanisms account for $30 billion in carbon revenues, and the European Union – Emission trading scheme (EU-ETS) is the biggest market with 50% market share (which is currently in it`s 3rd phase i.e. 2013-2020).
- The schemes usually function as Cap-and-Trade programs where there are sector/company wide annual caps on carbon emissions for which they are provided allowances (free/auction). Companies that emit lesser/more than the cap, trade the carbon allowances via an exchange at spot prices. The scheme is mandatory for large industries like Electricity, oil & gas, cement.
- Only EU and China (totally 11 industry countries) have the emission trading scheme. China`s scheme is not national (expected to be by end-2017) and is based on eight cities with similar features like EU-ETS (in terms of cap, allowances, sectors, and pricing)
- Only one brewing company in Europe has a major installation that is mandated to participate in the EU-ETS scheme.
The pricing overview of carbon trading mechanism and the future outlook
- The prices are high for the emission trading systems as compared to voluntary schemes primarily due to compliance demand from buyers and higher verification and transaction costs.
- Due to the success of the EU-ETS (emissions reduction range of 5-30% in industry countries during 2013-16) many new schemes are under consideration e.g. Mexico, Brazil, Russia, and Vietnam.
- The EU-ETS schemes also allow a certain portion of carbon offsets to be sourced internationally from voluntary markets (5-10% annual allowance).
- The rationale is to support development of the voluntary markets and lower carbon costs. The EU-ETS has the Certified Emission reduction (CER) offset from Clean development mechanism (CDM) and China has the domestic Chinese carbon emission reduction offsets (CCER)
Carbon emissions trading – Compliance & Voluntary
Carbon emissions trading has two distinct developed markets – Compliance and Mandatory. Both the markets are well developed with institutionalized systems as compared to renewable energy certificates mechanisms.
Compliance market
- Compliance market (also termed as emissions trading scheme/system) is typically a Cap-and-Trade system, where-in a certain cap is fixed for carbon emissions by specific sectors. Companies that emit less than their cap emissions can trade surplus allowances to those who emit higher than their cap. This incentivizes carbon emission reductions projects.
- The most developed compliance market is EU-ETS that was formulated in 2003 and active since 2005.
- Compliance markets tend to be national (like EU-ETS, Japan, Korea) or sub-national (Canada, USA, China).
Voluntary market
- Voluntary markets are based on the Kyoto protocol (joint initiative) and Clean development mechanisms (CDM). The voluntary markets provide an opportunity for multinational organizations or countries that want to reduce their emissions by reducing the emissions in developing nations.
- There are 2 main registries for voluntary carbon market which register projects – Markit Environmental registry and American Carbon registry.
- There are various independent & international carbon standards that guarantee the quality & facilitate carbon trade
The compliance markets have higher prices due to higher demand in the market for these carbon allowances, as companies have to pay heavy penalties, if they don`t acquire allowances for emissions higher than their cap value.The voluntary market is governed by supply-demand dynamics, where many companies participate without any mandatory requirements. There are many credits available in the market due to relatively lesser demand as compared to mandatory markets.
European Union – Emission Trading System
Allowances are allocated annually to member states in the EU-ETS system based on their share of historic emissions under the system. Germany is the biggest emitter in EU-ETS system & has also witnessed a 6% decline in its emissions since 2013 depicting system effectiveness.
Industry EU countries – Cap & Actual Emissions - 2016
- The EU-ETS system was providing free allocations to meet cap requirements to all sectors till 2012 (with a gradual decline). However, since the start of phase 3 in 2013, electricity industry has to mandatorily purchase all allowances via auctions.
- The manufacturing industry was still allocated free allocations for 80% of their cap emissions, but this expected to decline annually and be at 30% in 2020. Aviation also receives free allocations. Overall, around 57% of total emissions cap from 2013-2020 will be auctioned by the EU-ETS system.
Carbon offset pricing by third- party quality standards
Verified Carbon Standard (VCS) & Gold Standard are the two most utilized third-party standards for verification and issuance of carbon credits. The price of offsets from Gold Standard is double that of VCS, mainly due to the fact that Gold Standard offers additional benefits of offsets.
- Around 75% of the carbon offsets transacted in 2016 had either VCS or Gold Standard, as their third-party verification standard. The rapid growth of VCS since its inception in 2006,is primarily on account of its applicability. Also, as VCS offers basic certification with no added benefits, it`s price is considerably lower than other specialized carbon standards.
- The Gold Standard verification for carbon offsets provides further benefits to the buyer, apart from carbon offset, i.e. community development, rural livelihood, water conservation, etc. Hence the Gold Standard comes at a premium of 100% over VCS certified carbon offsets.
- The Climate, Community & Biodiversity (CCB) Standards were introduced as complementary to the VCS, to give similar benefits as that of the Gold Standard certified offsets. Hence, the price of VCS+CCB offsets is much closer to the Gold standard offsets.
Interesting Reads:
Discover the world of market intelligence and how it can elevate your business strategies.
Learn more about how market intelligence can enable informed decision-making, help identify growth opportunities, manage risks, and shape your business's strategic direction.
Get Ahead with AI-Enabled Market Insights Schedule a Demo Now
