CATEGORY
Utilities Natural Gas US
The report covers in detail the market supply demand dynamics, supplier landscape, pricing analysis and procurement best practices across the industries for US Natural Gas
Beroe LiVE.Ai™
AI-powered self-service platform for all your sourcing decision needs across 1,200+ categories like Utilities Natural Gas US.
Market Data, Sourcing & Supplier Intelligence, and Price & Cost Benchmarking.
Schedule a DemoThe World’s first Digital Market Analyst
Abi, the AI-powered digital assistant brings together data, insights, and intelligence for faster answers to sourcing questions
Abi is now supercharged with GPT4 AI engine. Enjoy the ease of ChatGPT, now on Abi
Utilities Natural Gas US Suppliers

Find the right-fit utilities natural gas us supplier for your specific business needs and filter by location, industry, category, revenue, certifications, and more on Beroe LiVE.Ai™.
Schedule a Demo


Use the Utilities Natural Gas US market, supplier and price information for category strategy creation and Quaterly Business Reviews (QRBs)
Schedule a DemoUtilities Natural Gas US market report transcript
Utilities Natural Gas US Industry Outlook
-
The US is a net exporter of natural gas and depends mainly on domestic production to meet the demand. Natural gas production is expected to increase by 3-4 percent in 2022 and is projected to grow by 2-3 percent in 2023
-
Dry gas production is expected to rise to 100.27 billion cubic feet per day (bcfd) in 2023 and 101.68 bcfd in 2024, up from a record 98.09 bcfd in 2022, according to the EIA
-
Domestic gas consumption is expected to fall to 87.04 billion cubic feet per day in 2023 and 86.10 billion cubic feet per day in 2024, down from a record 88.63 billion cubic feet per day in 2022

Industry Structure and Outlook
Production and Reserves
-
Natural gas proved reserves in the US risen by 152.1 trillion cubic feet (Tcf) (32 percent), from 473.3 Tcf at the end of 2020 to 625.4 Tcf at the end of 2021
-
Natural gas marketed production in the US will rise to an average of 106.5 billion cubic feet per day (Bcf/d) in 2022, before reaching a new high in 2023. Five projects got to add 897 million cubic feet per day (MMcf/d) of interstate natural gas pipeline capacity in 2022. Because of a greater emphasis on intrastate capacity and lower overall capital expenditures by oil and gas companies, interstate capacity additions were low in 2022
-
Dry natural gas production was reported at 100.2 bcf/day in Jan-23, which was higher as compared to Dec-22. Current working gas inventory levels stand at 2,583 bcf, which is higher by 9.4 percent as compared to last year and 66.7 percent higher as compared to last 5 years’ average
Supply and Demand
-
Natural gas supply in the US comes mainly from domestic production and pipeline imports. However, the country is a net exporter of natural gas. Natural gas import to the US is highly seasonal and depends on seasonal demand fluctuation, which tends to be low during summer
-
Natural gas supply was 106.62 Bcf/day in 2022, which increased by 4.3 percent from 2021. Gas consumption increased by 0.80 percent in 2022 Y-o-Y
-
According to the EIA, the average weekly consumption of natural gas in the US fell by 4.3 percent (3.9 Bcf/d) from the previous week. On 23rd March 2023 natural gas demand for power generation declined by 5.4 percent (1.7 Bcf/d) week over week, while industrial sector usage fell by 0.8 percent (0.2 Bcf/d) week over week
Consumption Profile : Utilities Natural Gas US
Market Consumption Scenario and Outlook
-
The natural gas consumption the in the US is anticipated to average 86.8 billion cubic feet per day (Bcf/d) in 2022, up 3-4 percent from 2021. Furthermore, in response to rising economic activity, the US industrial sector will consume more natural gas in 2022. We can anticipate that the natural gas consumption in the US will average 86-90 Bcf/d in 2023
-
The consumption of natural gas in the US surpassed a daily record high of 141.0 billion cubic feet on December 23, 2022. (Bcf). Freezing temperatures in mid- to late December enhanced demand for natural gas, which is used for residential and commercial space heating as well as producing electricity. At the same time, natural gas production started to drop due to mechanical problems caused by the cold temperature
-
The annual share of US electricity generation from natural gas will fall from 37 percent in 2021 to 36 percent in 2022, while the share from renewable energy sources will rise from 20 percent in 2021 to 22 percent in 2022 and is anticipated to increase in 2023
US Cost Structure Analysis : Utilities Natural Gas US
Cost Break-up
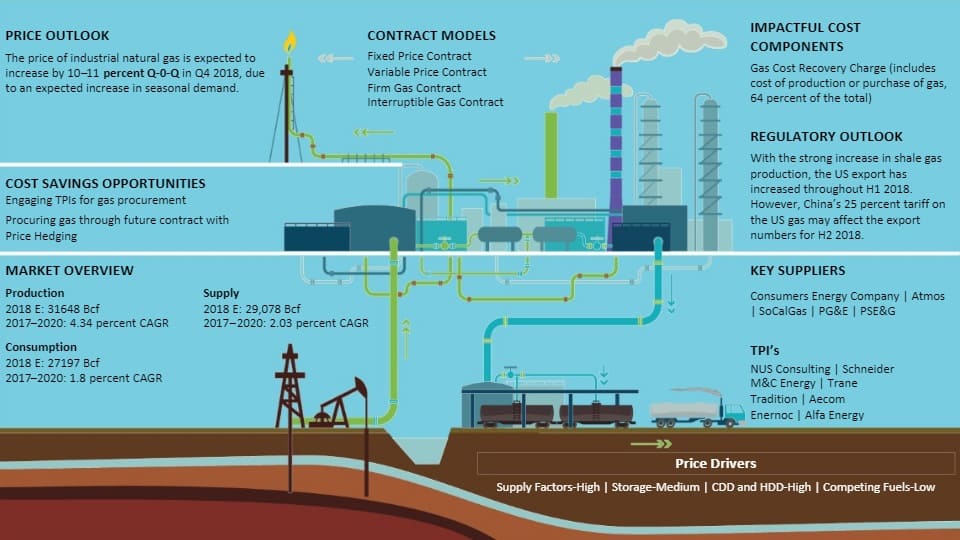
Gas Cost Recovery Charge
-
Gas cost recovery charge is the cost for the gas to reach a marketer or distributor at the wholesale market.
-
This includes the exploration and production cost, which is deregulated and decided by the upstream companies
Reservation and Distribution Charges and Margin
-
Reservation charges is the price the supplier pays the transmission pipeline companies. This cost can be passed on to the customer through their electricity bill
-
Reservation charges are generally charged to the retail open access customers
-
The cost incurred by the supplier to transport natural Gas through pipeline to the customer’s location is passed on in the form of distribution charges
-
It includes cost of storing gas, and operating the distribution network
Interesting Reads:
Discover the world of market intelligence and how it can elevate your business strategies.
Learn more about how market intelligence can enable informed decision-making, help identify growth opportunities, manage risks, and shape your business's strategic direction.
Get Ahead with AI-Enabled Market Insights Schedule a Demo Now
