CATEGORY
Utilities Electricity South Africa
The report covers in detail the market supply demand dynamics, supplier landscape, pricing analysis and procurement best practices across the industries for South African Electricity Market
Beroe LiVE.Ai™
AI-powered self-service platform for all your sourcing decision needs across 1,200+ categories like Utilities Electricity South Africa.
Market Data, Sourcing & Supplier Intelligence, and Price & Cost Benchmarking.
Schedule a DemoThe World’s first Digital Market Analyst
Abi, the AI-powered digital assistant brings together data, insights, and intelligence for faster answers to sourcing questions
Abi is now supercharged with GPT4 AI engine. Enjoy the ease of ChatGPT, now on Abi
Utilities Electricity South Africa Suppliers
Find the right-fit utilities electricity south africa supplier for your specific business needs and filter by location, industry, category, revenue, certifications, and more on Beroe LiVE.Ai™.
Schedule a Demo

Use the Utilities Electricity South Africa market, supplier and price information for category strategy creation and Quaterly Business Reviews (QRBs)
Schedule a DemoUtilities Electricity South Africa market report transcript
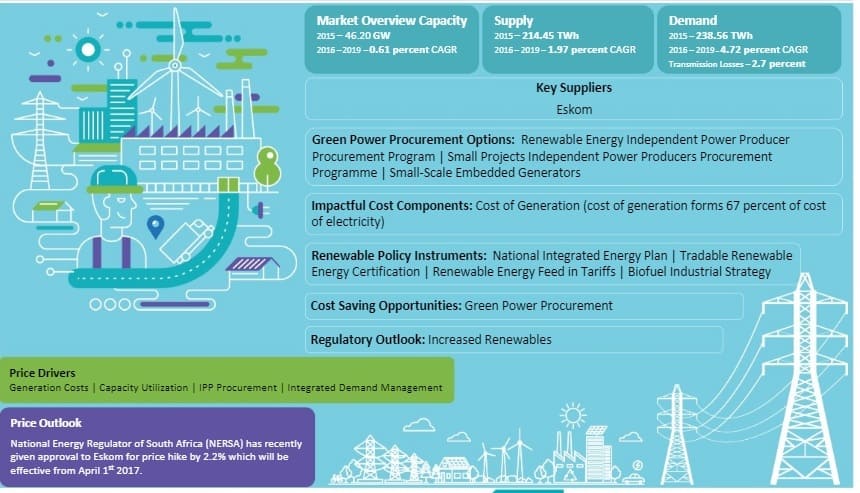
Regional Market Outlook on Utilities Electricity South Africa
-
The national demand is expected to grow at approx. 2-3 percent CAGR through 2022-2025
-
The electricity market in South Africa is a regulated market with the government controlling the majority of the assets in generation, transmission and distribution of electricity
-
South Africa ranks 7th among the countries who produce Coal. In 2020, the country has produced about 264.7 million tons of coal which is used both for local consumption as well as coal exports to other countries
-
70 percent of coal volume is consumed domestically and more than 70 percent of the electricity demand is generated from coal power
Industry Structure and Outlook : Utilities Electricity South Africa
Capacity
-
Among the overall installed capacity, the country relies majorly on thermal power with a capacity 49.52 GW (thermal)
-
Power shortages have been a major problem of the country because of heavy dependence on coal and domestic coal production, which is decreasing in the country
-
The government has announced that it is making plans to restructure South Africa's largest supplier into three operating units in order to reorganize the debt approved the tariff hike of 10 percent and will be implemented from April 2022 until March 2023 for non-local authorities who come under the ESKOM directly. This price hike was due to increasing debts in Eskom and the global increase for power feedstock price
Supply, Demand & Fuel Mix
-
Approximately over 90 percent of the power consumed in South Africa is produced by South Africa's largest supplier and the rest is produced by IPP’s and imported different countries
-
Electricity generation through coal-fired power plants increased, due to heavy domestic demand observed from different end-user in the country, especially in the summer season
-
Country’s over dependence on coal is affecting the penetration of renewable energy generation. Due to this, the end-user face fluctuations in the prices of electricity, along with frequent outages
Generation Profile
-
Coal contributes to around 70 percent to primary consumption of electricity, and 90 percent to the total generation of electricity in South Africa
-
Amongst renewable energy sources, wind energy, and solar PV are some of the major sources for which the country is developing proper infrastructure
-
South Africa's largest supplier’s heavy dependence on coal for electricity generation, and low domestic production of coal has led to increased coal imports in South Africa, due to which, the electricity prices are also getting affected in the country
-
Decreasing value of Rand because of slowdown in the economy is affecting the prices of commodities in the country
Consumption Profile
-
Electricity consumption decreased, primarily due to a decrease in power consumption by the industries, due to COVID and is expected to bounce back in 2022. The increase in Independent Power Producers (IPP) is continuously making efforts to increase their market share with renewable energy projects. Moreover, heavy industrialization activities are also one of the major driving forces behind increasing electricity consumption in the country
-
Electricity consumption is expected to increase in the upcoming few years, as demand is increasing with the increasing population. Also, the country is planning to gradually shift toward energy generation through renewable sources, so it is expected that the age-old coal-fired power plants will be shut down in the upcoming times. This will result in increased demand of electricity, and hence, increased burden on suppliers to meet the demand of end-users
Cost Break up : Utilities Electricity South Africa
-
Generation cost shares 65–68 percent from the total cost break up based on the transmission zone
-
Value added tax is added on each component of electricity charge and varies from 13 percent to 14 percent for different components
-
The government is also trying to include nuclear power generation into the power mix of the country. This inclusion might increase the cost of electricity generation and also slow down the growth of renewables
Utilities Electricity South Africa Price Drivers
-
In South Africa, electricity prices are determined by multiyear price determination method (MYPD), where South Africa's largest supplier determines the prices by taking into consideration the future capacity additions, GDP growth, CPI, PPI; and the prices are reviewed by NERSA
-
The average industrial prices of electricity have increased to almost 10 percent during the period April 2022 until March 2023, mainly due to improving the revenue of South Africa's largest supplier and the global energy crunch which increased the coal prices
Interesting Reads:
Discover the world of market intelligence and how it can elevate your business strategies.
Learn more about how market intelligence can enable informed decision-making, help identify growth opportunities, manage risks, and shape your business's strategic direction.
Get Ahead with AI-Enabled Market Insights Schedule a Demo Now