CATEGORY
USA Electricity
The report covers in detail the market supply demand dynamics, supplier landscape, pricing analysis and procurement best practices across the industries for US Electricity
Beroe LiVE.Ai™
AI-powered self-service platform for all your sourcing decision needs across 1,200+ categories like USA Electricity.
Market Data, Sourcing & Supplier Intelligence, and Price & Cost Benchmarking.
Schedule a DemoThe World’s first Digital Market Analyst
Abi, the AI-powered digital assistant brings together data, insights, and intelligence for faster answers to sourcing questions
Abi is now supercharged with GPT4 AI engine. Enjoy the ease of ChatGPT, now on Abi
USA Electricity Suppliers
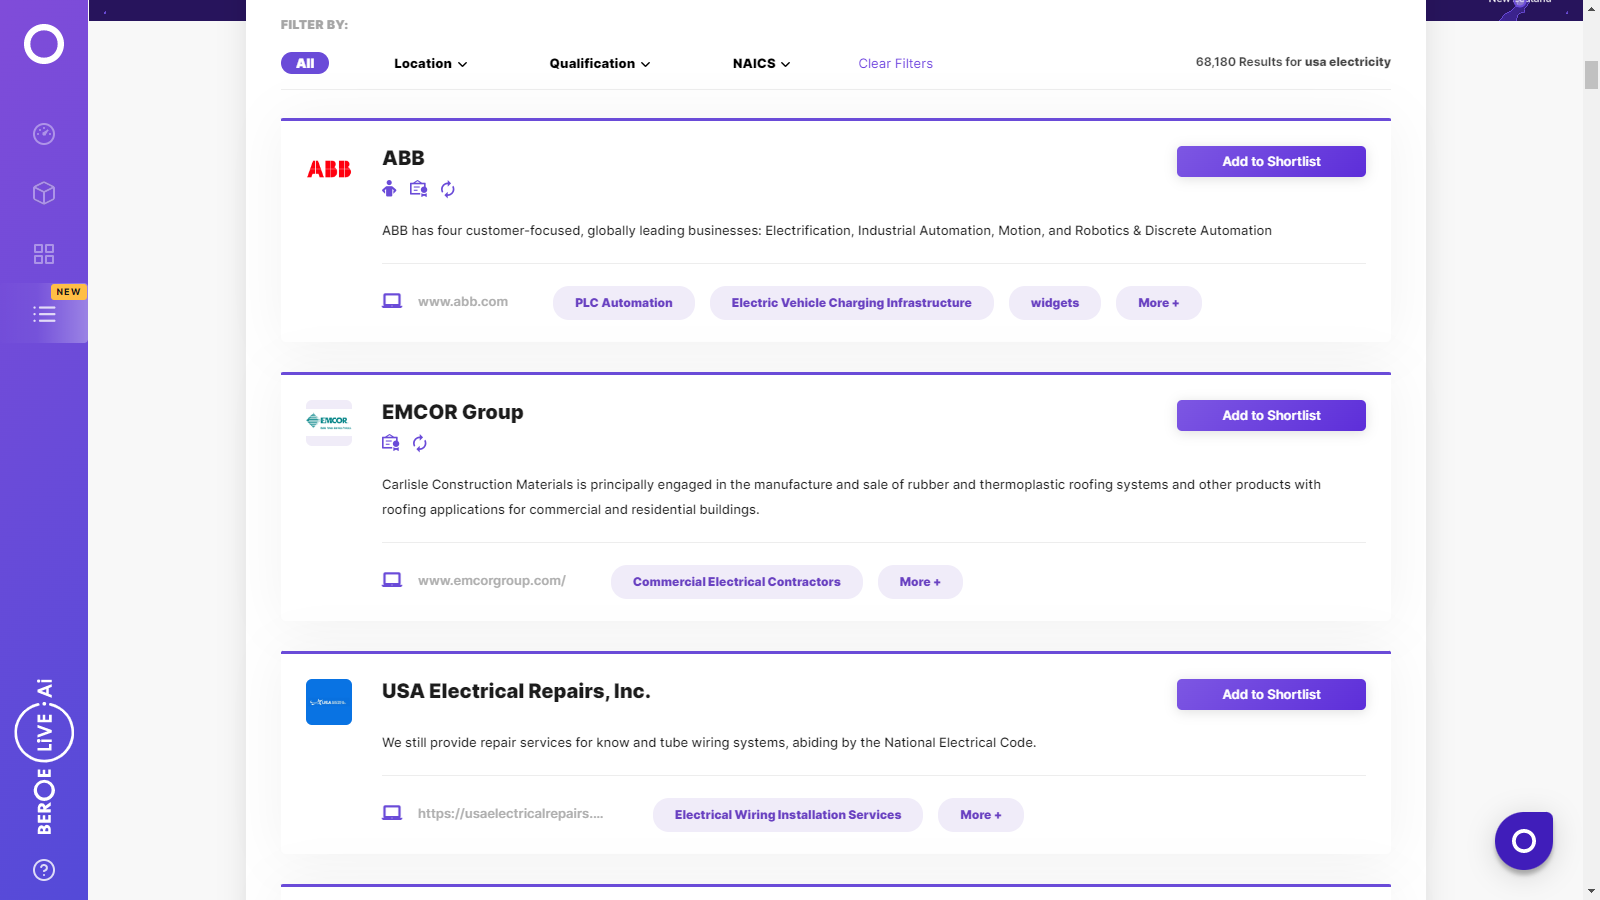
Find the right-fit usa electricity supplier for your specific business needs and filter by location, industry, category, revenue, certifications, and more on Beroe LiVE.Ai™.
Schedule a Demo

Use the USA Electricity market, supplier and price information for category strategy creation and Quaterly Business Reviews (QRBs)
Schedule a DemoUSA Electricity market report transcript
USA Electricity Industry Structure and Outlook
-
Wind and solar combined account for 14 percent of US generation in 2022, and this figure is expected to rise to 16 percent by 2023. In 2023, the ERCOT region is expected to see the greatest shift in the generation mix. The US Department of Energy (DOE) has announced $13 billion in funding to support the modernization and expansion of the country's electric grid.
-
The EIA predicts that 9 GW of coal-fired power plant capacity will retire in 2023 and 2 GW will retire in 2024. Less electricity generation is primarily due to lower consumption in the residential and industrial sectors as a result of the expected decline in economic activity.
Supply Market Outlook : USA Electricity
-
The higher wholesale price in winter months and in 2022 would result in a higher retail industrial price. Wholesale electricity prices at major power trading hubs were 20-60 percent higher on average in December 2022. The availability of natural gas and renewable generation will determine the price of electricity in the US. Prices in the US are typically highest in the summer when total demand is high because more expensive generation sources are added to meet the increased demand
-
Only generation from renewable sources and natural gas is expected to witness positive annual growth in 2021 and 2022, driven by the increase in solar and wind generation, as well as a reduction in coal
Industry Structure and Outlook
Supply–Demand
-
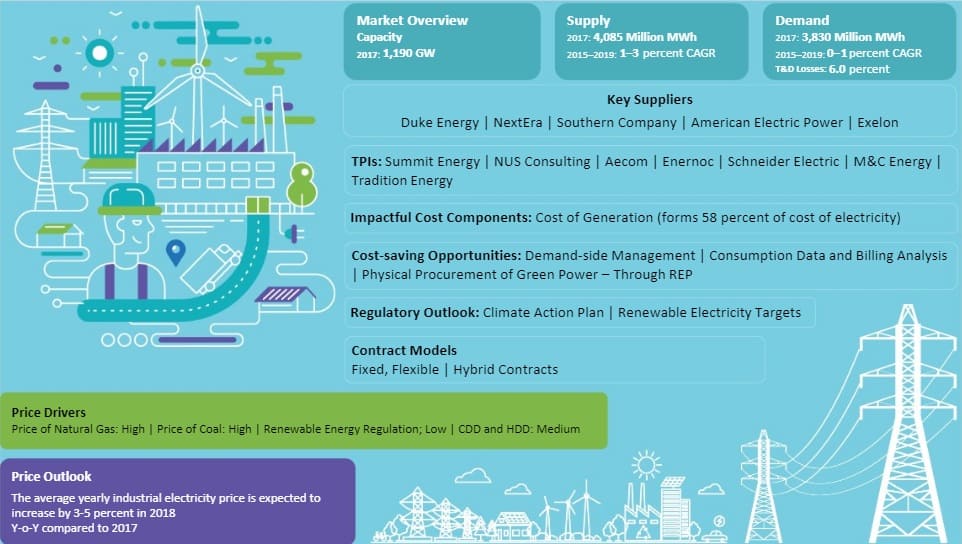
Electricity demand in the US is expected to increase at a CAGR of 0.5–1.0 percent from 2022 to 2025 and supply is expected to witness an increasing trend at a CAGR of 1.0–3.0 percent during the same period
-
Electricity supply in the US is expected to hit 4,216 million MWh in 2023, which decreased from 4,291 million MWh in 2022, a decrease of 1–2 percent Y-o-Y. The ongoing war crisis might as well have an impact on the supply decrease
-
Total electricity consumption in the US will remain relatively stable, falling by 1 percent in 2023 and then increasing by relatively more than 1.5–2 percent in 2024, according to the EIA
Porter’s Five Forces Analysis on USA Electricity
-
The electricity market in the U.S. is a highly mature market with private players contributing to majority of the share in all the GTD segments
-
Buyers have an option to avail the services from any of the supplier for procuring electricity. This gives considerable power to the buyers in the market
Supplier Power
-
There is a heavy competition in every electricity market segment, namely generation, transmission, distribution, and wholesale markets
-
Power industry requires a considerable amount of investment, due to which the number of suppliers faces barriers to entry
-
Any change in the price of fuel used in the generation of electricity will have a direct impact on the price of electricity
-
A customer can switch to any of other supplier in a deregulated market with minimum hustle. This limits the power of supplier
Barriers to New Entrants
-
High capital expenditure for setting up an utility plant and stringent regulatory approval norms
-
Competing with an already existing established player
-
High maintenance cost, environmental regulations, and insurance to cover on-site accidents are some of the major issues that makes it difficult for new players to enter in the market
Intensity of Rivalry
-
Intense competition amongst the power companies that usually function at a different strategic level
-
Since the electricity market is saturated in the U.S., the suppliers are trying to achieve economies of scale by continuous innovation to maintain low prices to expand their markets
Threat of Substitutes
-
Electricity cannot be substituted with other forms of energy
-
Usage of coal is decreasing, due to environmental targets of the U.S.. However, the U.S. has got natural gas resources to substitute coal for generation of electricity. So, it will not have any considerable effect on the supply of electricity
Buyer Power
-
Since the end commodity is electricity, the quality of the product is not a concern
-
The electricity market in the U.S. is highly competitive. An industrial consumer has a lot of options to choose from, in terms of electricity supplier
-
Since the U.S. has increased electricity generation through renewable sources, the overall electricity suppliers have increased
Price Drivers : USA Electricity
-
Prices of feedstock, such as coal and natural gas, which fuel ~60 percent of the total electricity generated, are the major drivers for electricity prices in the U.S.. An increase/decrease in the prices of these feedstock will have a direct impact on the electricity price
-
CDD(Cooling Degree Days) is one of the major drivers, which impact the prices of electricity. With an increased CDD, there will be a higher cooling demand, which will, in turn, increase the electricity demand, thereby exerting an upward pressure on electricity prices in the short term
Interesting Reads:
Discover the world of market intelligence and how it can elevate your business strategies.
Learn more about how market intelligence can enable informed decision-making, help identify growth opportunities, manage risks, and shape your business's strategic direction.
Get Ahead with AI-Enabled Market Insights Schedule a Demo Now