CATEGORY
Renewable Energy
Global renewable energy installation has been increasing with a CAGR of 7.33% from 2007 to 2017. The global demand for renewable energy is expected to increase due to the shift towards clean energy. Increase in global warming temperature and environmental impacts have shifted the energy consumption from fossil fuel to renewable sources .
Beroe LiVE.Ai™
AI-powered self-service platform for all your sourcing decision needs across 1,200+ categories like Renewable Energy.
Market Data, Sourcing & Supplier Intelligence, and Price & Cost Benchmarking.
Schedule a DemoCategory Alerts
The Corio-Qair JV has qualified for the most recent French tender rounds.
March 28, 2023Renewable electricity in the United States surpassed coal in 2022.
March 28, 2023As tax breaks dwindled, new wind energy capacity in the United States fell by 56%.
March 28, 2023Become a Beroe LiVE.Ai™ Subscriber to receive proactive alerts on Renewable Energy
Schedule a DemoRenewable Energy Industry Benchmarks
Savings Achieved
(in %)
The average annual savings achieved in Renewable Energy category is 8.10%
Payment Terms
(in days)
The industry average payment terms in Renewable Energy category for the current quarter is 46.4 days
Compare your category performance against peers and industry benchmarks across 20+ parameters on Beroe LiVE.Ai™
Category Strategy and Flexibility
Engagement Model
Supply Assurance
Sourcing Process
Supplier Type
Pricing Model
Contract Length
SLAs/KPIs
Lead Time
Supplier Diversity
Targeted Savings
Risk Mitigation
Financial Risk
Sanctions
AMEs
Geopolitical Risk
Cost Optimization
Price per Unit Competitiveness
Specification Leanness
Minimum Order Quality
Payment Terms
Inventory Control
The World’s first Digital Market Analyst
Abi, the AI-powered digital assistant brings together data, insights, and intelligence for faster answers to sourcing questions
Abi is now supercharged with GPT4 AI engine. Enjoy the ease of ChatGPT, now on Abi
Renewable Energy Suppliers
Find the right-fit renewable energy supplier for your specific business needs and filter by location, industry, category, revenue, certifications, and more on Beroe LiVE.Ai™.
Schedule a Demo

Use the Renewable Energy market, supplier and price information for category strategy creation and Quaterly Business Reviews (QRBs)
Schedule a DemoRenewable Energy market report transcript
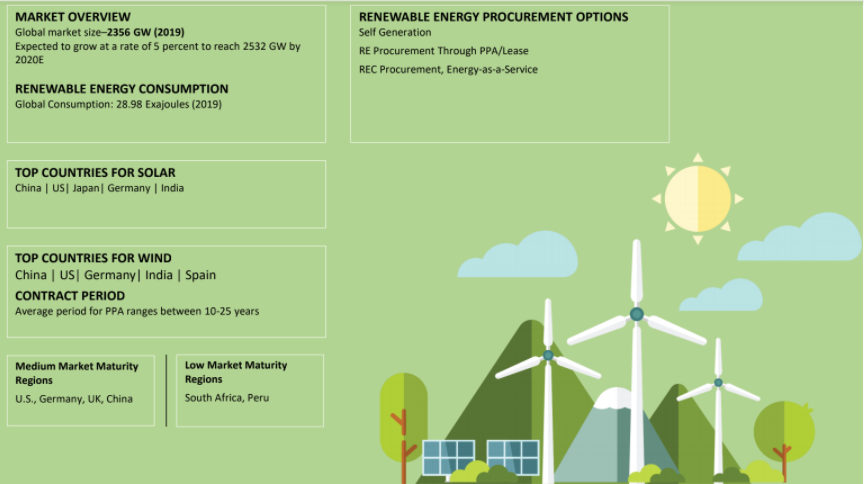
Renewable Energy Global Market Outlook
-
In 2023, the demand for renewable energy is expected to rise, as awareness of climate change, net zero targets, backing for environmental, social, and governance (ESG) factors and demand from the majority of market segments for cleaner energy sources rise. The global renewable energy capacity additions are expected to increase by 8–10 percent in 2023 compared to the previous year to reach more than 3,963.4* GW
-
The invasion of Ukraine by Russia has prompted nations to reschedule their plans to phase out fossil fuels. They are rushing toward oil, gas, and coal, while simultaneously moving away from them in their pursuit of more reliable energy sources. Major companies are speeding their plans to switch to green energy sources, like wind and solar power at the same time, particularly in Europe
Renewable Energy Demand Market Outlook
-
The renewable energy capacity additions are expected to increase by 8–10 percent to reach 3,609.8 GW in 2022. The upcoming year holds new growth opportunities for the renewable energy sector, which may be supported by pro-renewable energy administration initiatives.
Global Installed Capacity: Renewable Energy
-
The global renewable energy installation is expected to increase by 8–10 percent in 2022
-
Total renewable energy installation reached 3,063 GW in 2021, with an increase of 9.46 percent compared to 2020. An increase of 8–10 percent in RE installations is expected in 2022. The third wave of the COVID-19 pandemic in Q1 2022 resulted in the slow down of RE projects in the Asia Pacific region
-
Of the increase in RE installations, the increase in Solar PV systems accounts for 132 GW and wind power installations constitute for 93.1 GW across the globe in 2021
-
China leads the way for renewable hydropower (354 GW), solar (306 GW), wind (328 GW), in terms of installed capacity in 2020. Geothermal energy is most popular in the US, with an installed capacity of 3.8 GW
-
New technologies, such as marine energy, have been implemented in the Republic of Korea, leading to an installed capacity of 0.256 GW, making it the world’s leader in this technology, followed by France at 0.212 GW of installed capacity. China is the leading country when it comes to bio-energy with 29.7 GW of installed capacity
Porter's Five Forces Analysis on Renewable Energy
Supplier Power
-
Supplier has a certain amount of power in reducing profit margins and the industry profitability for renewable energy
-
The more concentrated is the whole supplier’s industry, the higher is their bargaining power
-
The advancement in technology has helped in reducing the cost of manufacturing and increased competition
Barriers to New Entrants
-
The barrier for new entrant is medium, due to the many support scheme offered by the government
-
The barrier for new entrant depends on the economics of scale, capital Investment, government policies, and products differentiation
Intensity of Rivalry
-
Intensity of rivalry is high, due to the presence of new emerging companies globally. The presence of incentives and subsidies focused toward renewable energy has given it a boom for new companies to enter into the market
-
The presence of global warming has also increased the companies to focus on clear energy
Threat of Substitutes
-
The obvious substitution for renewable energy would be electricity generated from fossil-fuel or nuclear power stations
-
Economic benefits of renewable energy substitutes make this the most severe threat level in the industry
Buyer Power
-
Buyers power is medium, due to the large number of small-sized buyers and small number of energy supplier
-
Buyers have medium power, as they have the option to shift to different generators, due to the low cost that offered by energy supplier
-
Energy buyers are more price sensitive in choosing the energy supplier
Supply Trends and Insights : Renewable Energy
Type of Suppliers
-
Market share: The global energy companies are expected to increase the share of renewable energy business. The 70 percent of the entire supply chain market for solar and wind remains with China
-
EPC: Many renewable energy companies take up complete value chain of renewable energy, which includes Design, EPC, maintenance of renewable energy projects. Off late, importance is given to companies, which come up with financing models, such that the buyer need not think of initial investments for these projects
Supplier Trends
-
Merger & acquisition: Veolia Group acquires 29.9 percent of Suez’s capital from Engie on October 2020. This would strengthen the renewable energy projects expertise for Veolia in France
-
EDF renewable has acquired LUXEL Group, solar company of France. The company holds for 1 GWp operations in France with few more projects in hand
Engagement Trends
-
Most adopted model globally: PPA/EaaS
-
Why: Buyers prefer engaging with the energy infrastructure companies through an EaaS/PPA agreement, as the model ensures off the book financing model, and also, the risk of operation & maintenance shifts with the supplier
-
Contract length: 10–20 years
Interesting Reads:
Discover the world of market intelligence and how it can elevate your business strategies.
Learn more about how market intelligence can enable informed decision-making, help identify growth opportunities, manage risks, and shape your business's strategic direction.
Get Ahead with AI-Enabled Market Insights Schedule a Demo Now