CATEGORY
Passive Components
Beroe LiVE.Ai™
AI-powered self-service platform for all your sourcing decision needs across 1,200+ categories like Passive Components.
Market Data, Sourcing & Supplier Intelligence, and Price & Cost Benchmarking.
Schedule a DemoPassive Components Market Monitoring Dashboard
Understand the correlation between costs, margins, and prices impacting your category on a real time basis on Beroe LiVE.Ai™
Schedule a DemoPassive Components Industry Benchmarks
Savings Achieved
(in %)
The average annual savings achieved in Passive Components category is 12.00%
Payment Terms
(in days)
The industry average payment terms in Passive Components category for the current quarter is 60.0 days
Compare your category performance against peers and industry benchmarks across 20+ parameters on Beroe LiVE.Ai™
Category Strategy and Flexibility
Engagement Model
Supply Assurance
Sourcing Process
Supplier Type
Pricing Model
Contract Length
SLAs/KPIs
Lead Time
Supplier Diversity
Targeted Savings
Risk Mitigation
Financial Risk
Sanctions
AMEs
Geopolitical Risk
Cost Optimization
Price per Unit Competitiveness
Specification Leanness
Minimum Order Quality
Payment Terms
Inventory Control
The World’s first Digital Market Analyst
Abi, the AI-powered digital assistant brings together data, insights, and intelligence for faster answers to sourcing questions
Abi is now supercharged with GPT4 AI engine. Enjoy the ease of ChatGPT, now on Abi
Passive Components Suppliers
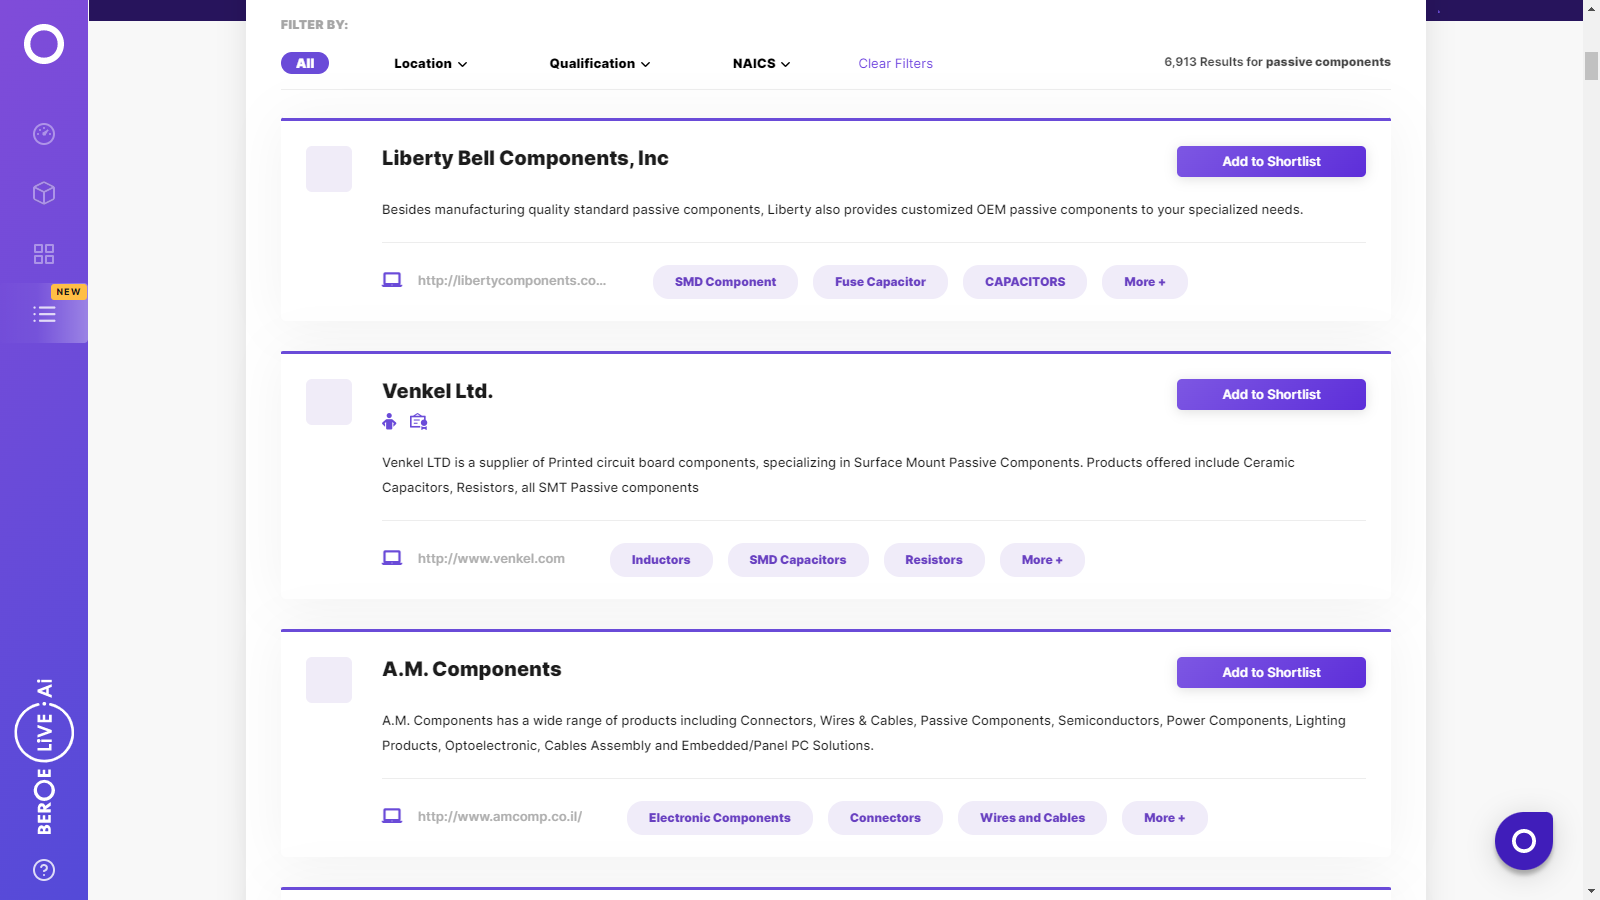
Find the right-fit passive components supplier for your specific business needs and filter by location, industry, category, revenue, certifications, and more on Beroe LiVE.Ai™.
Schedule a Demo

Use the Passive Components market, supplier and price information for category strategy creation and Quaterly Business Reviews (QRBs)
Schedule a DemoPassive Components market report transcript
Passive Components Global Market Outlook:
Market Overview
Passive Components : $34.8 billion (2022E), expected to grow at a CAGR of 6.5 percent CAGR from 2021 to 2025.
Global Market Outlook
Global Maturity: High
Global Capacity: Tight Supply (2021–2025)
Regional Outlook : Passive Components
-
The global passive components market reached $34.8 billion and is expected to grow by 6.5 percent from 2021 to 2025
-
The increase in hybrid electric vehicles, such as EV Cars, is rapidly reducing the environmental burden and increasing the number of ECUs (electronic control units), thereby leading to stronger demand for passive components, whose miniaturization and further performance improvements have been rising
-
Japan and South Korea are the two major economies in the APAC that drive the passives market. The transportation sector is one of the critical infrastructures that supported the Japanese economy and evolved, along with other industries' growth. Japan is striving towards adopting electric vehicle technology on a mass scale. Toyota, who is one of the largest car manufacturers, has partnered with another player, Mazda, to develop electric vehicle technologies for electric cars, including mini-vehicles, SUVs, passenger cars, and light trucks
Global Market Overview: Electronic Components
-
The passive components industry has been witnessing a significant growth in 2022 from 5G, industrial and automotive applications, however, due to 3rd wave lockdowns in the APAC, they had difficulty in procuring raw materials from various regions, which has started easing in late Q2 2022
-
The industry is expected to remain elevated, with increasing fashion for automotive and industrial demand. The key industries, like automotive, smartphones, and 5G communication, are expected to witness continuous demand throughout 2022. However, the passive components are witnessing demand from data center, due to increasing use of internet, as people started using more online platforms, like live stream, online entertainment apps and business applications
Porter’s Five Forces Analysis on Passive Components
Supplier Power
Supplier Size
-
Component providers have medium to low power, based on the industry they cater to
-
For fragmented market in the consumer and devices segment, component suppliers have lower power
-
For consolidated, industrial/automotive segments, component suppliers have medium power
Competition
-
The market is surrounded by several suppliers, still it is dominated by a small number of key players. This results in gaining supplier power.
Barriers to New Entrants
Infrastructure
-
The foremost barrier for a new entrant is resources and the capital cost required to start a plant. It is in addition to labor, transportation, and warehousing
Brand Differentiation
-
Though there is a potential for a new entrant to compete head-to-head with key players, brand differentiation strengthens the new entrant only to a limited extent, especially for semi-conductors
Switching Cost
-
Customers find it challenging to switch from one supplier to a new entrant by changing the entire design
Intensity of Rivalry
Product Differentiation and Contractual Terms
-
Intense competition in the industry, with few differentiated service offerings are the main factors for high industry rivalry
-
Flexible contractual terms are being used to attract customers
-
The pressure remains with all the tier-2 players in the industry
-
Exit barriers for big players are also high, due to high cost of entry into the market
Threat of Substitutes
Switching Cost
-
For semi-conductors, high switching cost is involved that makes it difficult for substitutes to draw customers away from key players
-
For passives and interconnects, the switching cost is low, as there could be very similar passive component or interconnect that can substitute the existing product
Performance to Price Ratio
-
The switching cost differs for different electronic components, the low performance to price ratio of substitutes exerts a weak force in the industry environment
Buyer Power
Total Spend
-
With the ever-increasing buyer spend on electronic components, the buyer’s ability to bargain and obtain value-added services is high
Contracts
-
For semi-conductors, supplier alliances are formed in a long-term basis, so buyer’s power is generally high during long-term over short-term
-
There is a mild backward integration risk, due to large entry barriers. For passives & interconnects, they generally focus on procurement from distributors rather than suppliers for commoditized products
Interesting Reads:
Discover the world of market intelligence and how it can elevate your business strategies.
Learn more about how market intelligence can enable informed decision-making, help identify growth opportunities, manage risks, and shape your business's strategic direction.
Get Ahead with AI-Enabled Market Insights Schedule a Demo Now