CATEGORY
Cables
Cables which helps in transmission of electrical power or signals which may or may not have insulation on it. Every industry uses cables for their electrical connectivity
Beroe LiVE.Ai™
AI-powered self-service platform for all your sourcing decision needs across 1,200+ categories like Cables.
Market Data, Sourcing & Supplier Intelligence, and Price & Cost Benchmarking.
Schedule a DemoCategory Alerts
NKT Secures Record-breaking High-Voltage Power Cable Deals in Dutch North Sea
March 07, 2023?120 M loan granted by CDP in favor of innovation and digitalization
March 07, 2023igus goes Hybrid: 2 New Cables suitable for Bosch Rexroth and Siemens
February 09, 2023Become a Beroe LiVE.Ai™ Subscriber to receive proactive alerts on Cables
Schedule a DemoCables Market Monitoring Dashboard
Understand the correlation between costs, margins, and prices impacting your category on a real time basis on Beroe LiVE.Ai™
Schedule a DemoCables Industry Benchmarks
Savings Achieved
(in %)
The average annual savings achieved in Cables category is 6.90%
Payment Terms
(in days)
The industry average payment terms in Cables category for the current quarter is 63.8 days
Compare your category performance against peers and industry benchmarks across 20+ parameters on Beroe LiVE.Ai™
Category Strategy and Flexibility
Engagement Model
Supply Assurance
Sourcing Process
Supplier Type
Pricing Model
Contract Length
SLAs/KPIs
Lead Time
Supplier Diversity
Targeted Savings
Risk Mitigation
Financial Risk
Sanctions
AMEs
Geopolitical Risk
Cost Optimization
Price per Unit Competitiveness
Specification Leanness
Minimum Order Quality
Payment Terms
Inventory Control
The World’s first Digital Market Analyst
Abi, the AI-powered digital assistant brings together data, insights, and intelligence for faster answers to sourcing questions
Abi is now supercharged with GPT4 AI engine. Enjoy the ease of ChatGPT, now on Abi
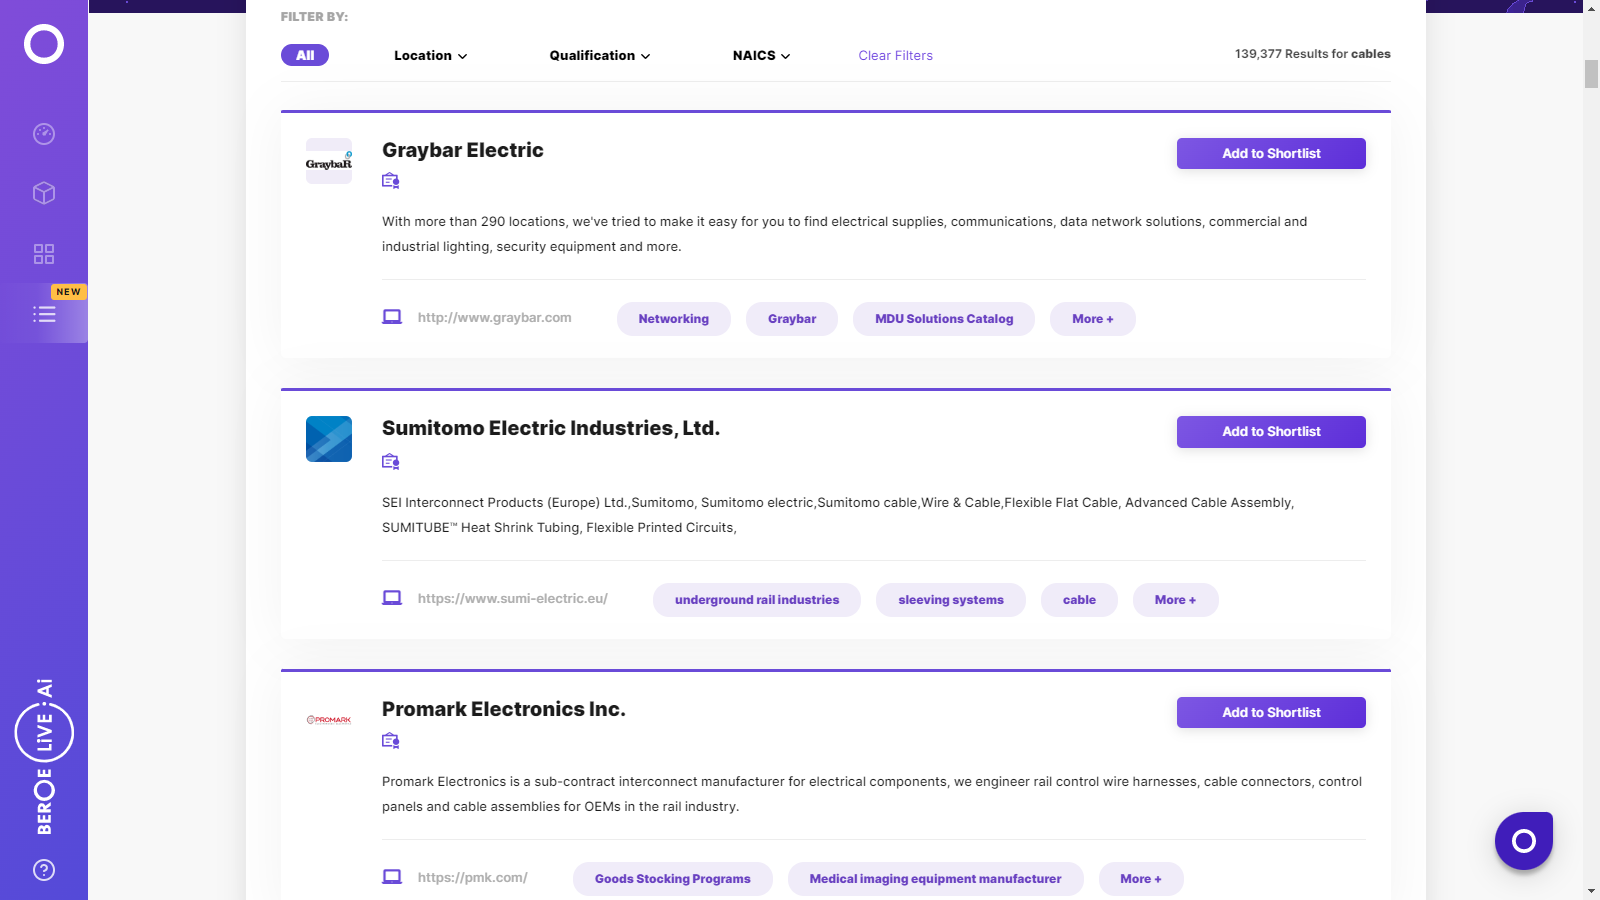
Cables Suppliers

Find the right-fit cables supplier for your specific business needs and filter by location, industry, category, revenue, certifications, and more on Beroe LiVE.Ai™.
Schedule a Demo


Use the Cables market, supplier and price information for category strategy creation and Quaterly Business Reviews (QRBs)
Schedule a DemoCables market frequently asked questions
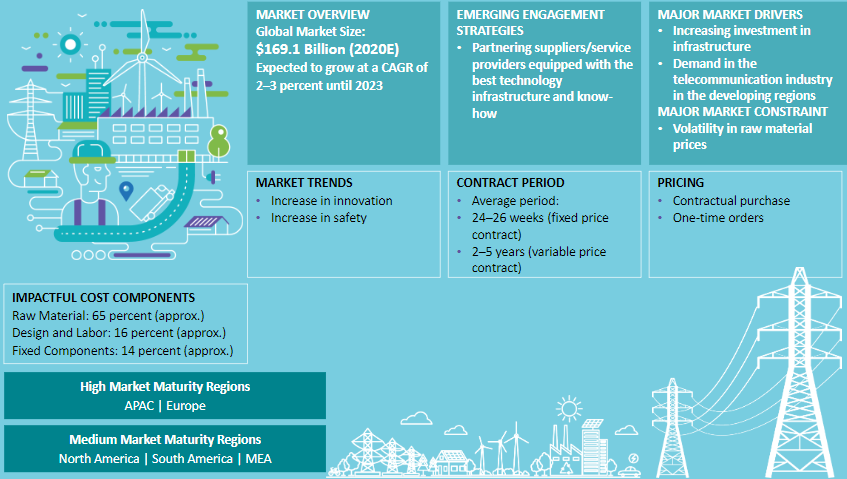
According to Beroe's analysis, the global market size of the wires and cables industry stands at a valuation of $181.30Bn and it's expected that it will grow at a CAGR of 4.5 ' 5 percent by 2021.
Beroe's report indicates that partnering with suppliers/service providers and equipping them with the best technology infrastructure and know-how is the core engagement strategy in the wire and cable industry.
Following the insights in the wire and cable industry outlook report, APAC and Europe region belong to the high-maturity region, while South America, North America, and the MEA fall under the medium-maturity regions for the cable industry. APAC will continue to dominate the industry and will grow at a rate of 2 -3%
The contract period depends on whether the contract is a fixed-price or variable-price contract. In the former case, the average duration is 24 ' 26 weeks, and if the contract is variable-price, the duration is 2 ' 5 years.
According to Beroe, the top six global suppliers of the cables market include the following names: Prysmian + Draka (6 percent) Fujikura (4.5 percent) Furukawa Electric (5.5 percent) Sumitomo Electric (3 percent) Southwire (3.2 percent) Nexans (3 percent)
The components include the names of the following: Raw Materials (65 percent approximately) Design and labor (16 percent approximately) Fixed components (14 percent approximately)
According to the analysis, the global cable market is divided into two industry segments namely ' electrical and telecom/datacom cables. Its sub-categories include -LV energy, Power Cables, Ext & Int. Telecom, Winding Wires, and Fiber Optic Cables. The report indicates that the market will reach a valuation of $195.24 billion by 2021 at a CAGR of 2 -3 percent.
The global power cables market is categorized into LV, MV, HV, and EHV cables wherein, LV cables hold nearly 50 percent of the market share with voltage below the 1kV. The MV cables voltage lies in the range of 1 ' 33 kV and it's the second-largest market holder. The voltage range of HV cables fall within 33 ' 230 kV range, and for EHV, it's generally above the 230-kV range.
The key drivers for the telecom cable market include ' increase in demand from the ICT sector especially from China, India, and Malaysia. The power cables market, on the contrary, is getting influenced by the increased demand for electricity from developed regions like China, the U.S., India, etc. due to rapid industrialization and urbanization. The wire and cables market outlook report shared by Beroe also indicates that volatility in copper, aluminum, and crude oil prices impede the growth of the cable industry. Further, regulatory issues, difficulty in establishing an optimal interconnection arrangement in the subsea cables, volatility in raw material prices, etc. are the primary constraints of the cable market.
Cables market report transcript
Cable Market Analysis and Global Outlook
-
Asia Pacific holds approx. 35 percent of the global cable market share and will continue to dominate the market. It is expected to grow at the rate of 3-4 percent CAGR over the forecasted period.
-
Increasing demand for electricity in the emerging and developed countries backed by increasing investment in the network and building infrastructure is expected to drive the cable market globally. Zero-COVID policy and Russia–Ukraine war have created an impact on the supply market; thereby causing lead time delays and price increase

Global Cables - Market Maturity
-
Amidst Omicron spread, the global cable market is gaining its demand traction from various downstream industries, like public infrastructure and construction initiatives and energy transition trends.
Global Cables Market - Trend and Classification
-
The outbreak of COVID-19 has had an impact on many industries across sectors, including the manufacturing industry. The resulting lockdown caused significant disruption in the supply chain. The demand is expected to strengthen further in the coming years, driven by increased public infrastructure and construction initiatives and energy transition trends.
-
Increasing industrialization, need for power infrastructure, growing demand for telecommunication especially in data network drives the cable market globally. The total market value of cable is projected to reach about 177.70 billion in 2025, at a CAGR of 2–3 percent up until 2025 globally, while the cables market is gaining its momentum post-pandemic first, second wave and omicron spread, due to government’s initiative to build their economy
-
The global cables market is widely defined into two broader segments, such as electrical and telecom/datacom cables, which could be used in various end-use applications. They are further categorized into power cable (low voltage, medium voltage, high voltage, and extra high voltage), ext. and int. telecom, winding wire, and fiber optic cable.
-
Building wire, vehicle wire, and appliance wire, which are the segments of the LV energy market, hold the major 35 percent of the market, followed by copper and aluminum power cable
Cables Regional Market Outlook - North America
-
All major global suppliers have cable manufacturing facilities and a strong distribution network in the region, which makes the supply strong in the region.
-
With an increased demand from the OEM/renewable sectors, as well as greater demand for fiber-optic, signal, control, and coaxial cable, the US has witnessed increasing demand. However, the past year had affected the US in a significant manner, as it was the largest pandemic affected nation in terms of number of affected people and death rate.
-
Amidst omicron spread, downstream industries are recovering gradually and expected to bring normalcy in coming years. However, a close watch is required to determine the magnitude of supply-demand fluctuations.
-
Evolving off-shore wind farm in US will create significant demand for subsea cable in the region.
Global Cables - Drivers and Constraints
Drivers
-
Increase in demand from the ICT sector post Covid globally and high demand in intelligent systems and IoT are the key drivers of the telecom cables market
-
Increasing adoption of off-shore windmill creates demand for sub-sea cable market
-
Cables industry will benefit from growing demand for renewable energy, where cable demand is 3–4 times higher for a 1 GW solar power plant than a conventional 1GW thermal power plant
-
The developed countries are integrating wind and other renewable energies. Also, HVDC cables in the electrical transmission, LV cables for building and vehicles, and active fibre optic cable market in the telecom are the huge areas for growth
-
The overhead electric transmission is moving underground in large cities, which will drive the demand for cables in future
Constraints
-
Regulatory issues that deal with offshore wind farms and difficulty of achieving an optimal interconnection arrangement in subsea cables are also the main constraints in the cables market
-
Volatility in copper, aluminum and crude oil prices is expected to restrain the growth of cables globally
-
Volatility in raw material prices and an increase in competition has created pressure on the manufacturers’ profit margin, due to which, some of the global suppliers in the industry have shifted their production facilities to regions that facilitate low cost of manufacturing
Supply Market Outlook
Global/ Regional Supplier
-
Global suppliers like Prysmian, Nexans, Leoni, Axon and others compete along with regional/local manufacturers like RR Kabels, Saudi cable company and other players, where the supply base is moderately consolidated in nature.
-
End use industries like building & infrastructure, power transmission & distribution, mining, telecom drives low voltage, medium voltage, high voltage power cables and copper cable, optical cable segment, followed by automotive industry and others.
Supplier Landscape
-
Many Tier 2 companies are involved in cabling services, such as installation and commissioning, maintenance and repairs, supply of spare parts, engineering, etc., thus supporting customers across all industries, increasing the reliability and increasing its service life.
-
Emerging supply base like Czech Republic, Taiwan, Vietnam, Mexico gives regional buyers opportunities to the avail advantages like lead time, cost savings and mitigate potential supply chain threats
Engagement Trends
-
Contract: There are generally two types of annual contracts for procurement of cables, such as fixed price contracts and variable price contracts
–In fixed price contracts: the price is fixed for a given duration
–In variable price contracts: the client and the supplier get into an agreement, wherein the final price is subject to variation, based on changes in key raw material prices
-
Contract Length: Fixed price (24–26 weeks, with a maximum of a year) and variable price (2–5 years)
Cost Structure Analysis –Global
-
Copper/aluminum, thermoplastics, rubber materials, and non-metallic elements form the raw materials for cables.
-
The raw materials constitutes around 65 percent of the overall cost structure. This cost structure is broken up into process to understand the process-related costs.
Raw Material
-
Copper/aluminum is the principal raw material used by the companies in the production of wire and cable products, representing ~50-70% percent of the total raw material costs for wire and cable
-
Thermoplastic is used in sheathing and enclosure of copper/aluminum rods as an outer cover
-
Rubber and non-metallic paper insulation elements are used inside the cables for strengthening and insulation of cables
Other Costs
-
Conversion cost includes machine rate, handling & finishing. while, manufacturing overheads, utility cost, maintenance cost & operator Cost are also included in the machine rate.
-
Labor, conversion cost, manufacturing, selling, general and administration costs constitute to ~20 percent of the cable cost structure
Interesting Reads:
Discover the world of market intelligence and how it can elevate your business strategies.
Learn more about how market intelligence can enable informed decision-making, help identify growth opportunities, manage risks, and shape your business's strategic direction.
Get Ahead with AI-Enabled Market Insights Schedule a Demo Now
