CATEGORY
Active Components
Beroe LiVE.Ai™
AI-powered self-service platform for all your sourcing decision needs across 1,200+ categories like Active Components.
Market Data, Sourcing & Supplier Intelligence, and Price & Cost Benchmarking.
Schedule a DemoActive Components Market Monitoring Dashboard
Understand the correlation between costs, margins, and prices impacting your category on a real time basis on Beroe LiVE.Ai™
Schedule a DemoActive Components Industry Benchmarks
Savings Achieved
(in %)
The average annual savings achieved in Active Components category is 7.30%
Payment Terms
(in days)
The industry average payment terms in Active Components category for the current quarter is 56.3 days
Compare your category performance against peers and industry benchmarks across 20+ parameters on Beroe LiVE.Ai™
Category Strategy and Flexibility
Engagement Model
Supply Assurance
Sourcing Process
Supplier Type
Pricing Model
Contract Length
SLAs/KPIs
Lead Time
Supplier Diversity
Targeted Savings
Risk Mitigation
Financial Risk
Sanctions
AMEs
Geopolitical Risk
Cost Optimization
Price per Unit Competitiveness
Specification Leanness
Minimum Order Quality
Payment Terms
Inventory Control
The World’s first Digital Market Analyst
Abi, the AI-powered digital assistant brings together data, insights, and intelligence for faster answers to sourcing questions
Abi is now supercharged with GPT4 AI engine. Enjoy the ease of ChatGPT, now on Abi
Active Components Suppliers
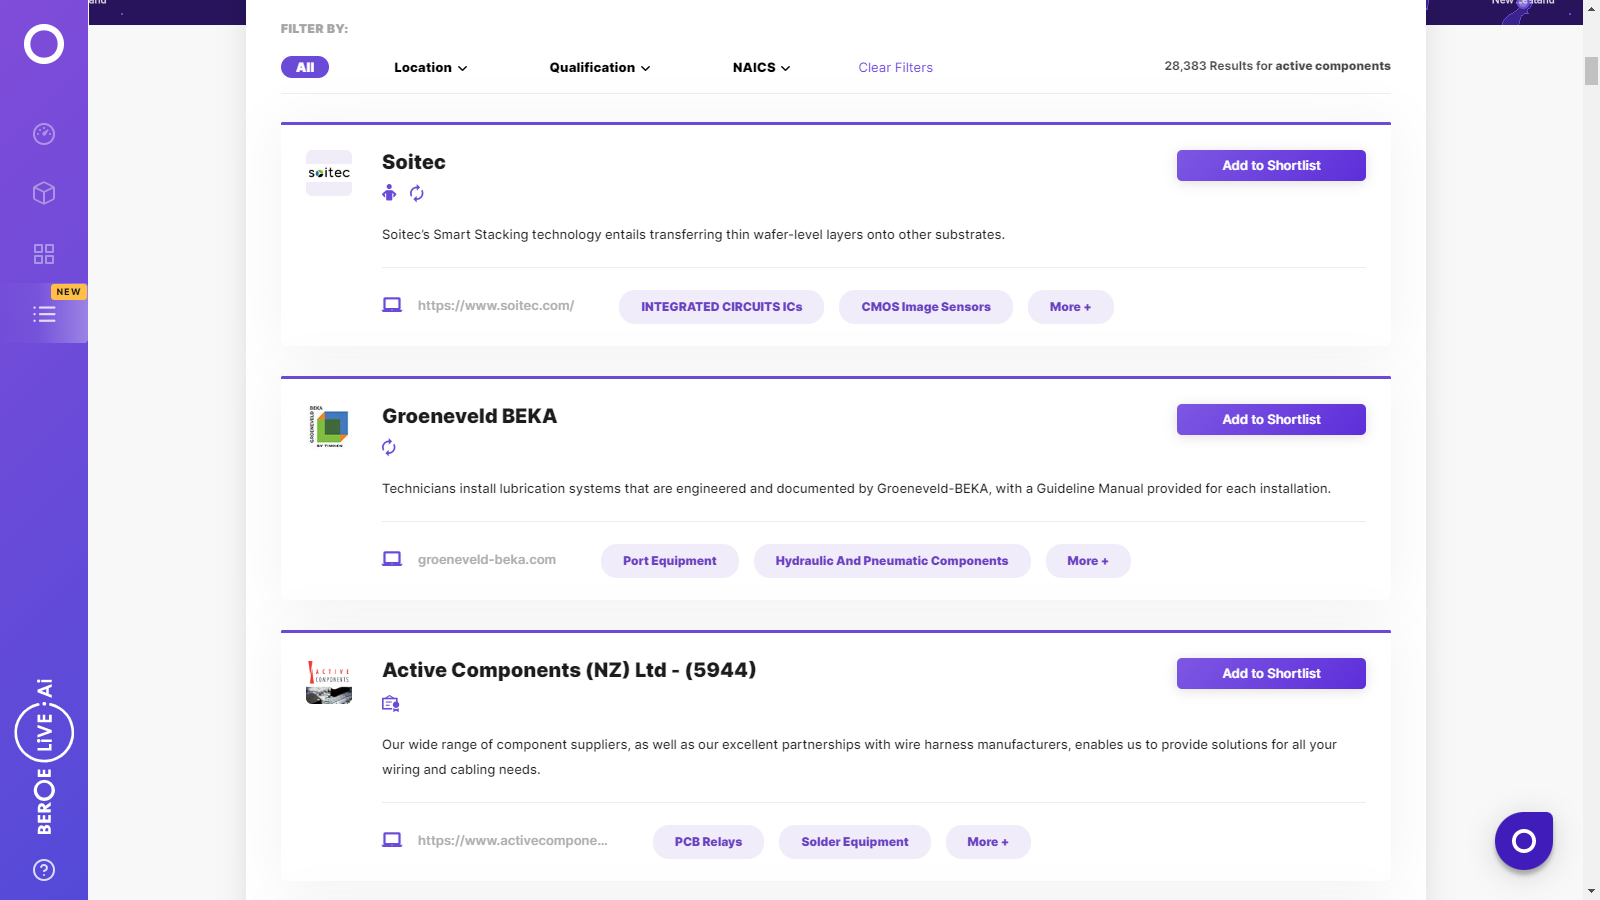
Find the right-fit active components supplier for your specific business needs and filter by location, industry, category, revenue, certifications, and more on Beroe LiVE.Ai™.
Schedule a Demo

Use the Active Components market, supplier and price information for category strategy creation and Quaterly Business Reviews (QRBs)
Schedule a DemoActive Components market report transcript
Active Components Global Market Outlook:
-
The semiconductor market is currently facing a huge demand that is positively driving the market and holding a market size of $575 Bn in 2022 and is expected to reach 698 Bn USD in 2025 with a CAGR of 8%.
-
There has been several wafer fabs being built at 300 mm across the world to meet up the demand, but 200 mm fabs are witnessing continuous shortage with the existing demand from various end-use from MEMS and power semiconductor chips. SilTerra from Malaysia, who is one of the popular fabs for 200 mm, have started expanding their capacity with an investment of 645 Million Malaysian Ringets. However, the 200 mm wafers would have challenges to expand, as the equipment for the same has become limited in the market
Active Components Demand Market Outlook
-
Across the world, there are more than 29 fab expansion plans initiated last year and in 2022 and are focused on existing and latest node technologies. However, mature nodes, like 28nm and above, plays a significant role in various functional devices starting from MCU, Power Management IC, Analog IC, Power Discretes, etc. TSMC announced its investment plans in Japan, Taiwan, and China with focus on N12, N16, N22, and N28 nodes.
-
The electronic component pricing has been stabilizing for commodity-based components, while application-specific components continue to increase for automotive, industrial and communication components.
Porter's Analysis on Active Components
Supplier Power
- Supplier Size
-
Component providers have medium to low power, based on the industry they cater to
-
For fragmented market in the consumer and devices segment, component suppliers have lower power.
-
For consolidated, industrial/automotive segments, component suppliers have medium power
- Competition
- The market is surrounded by a large number of suppliers, still it is dominated by a small number of key players. This results in gaining supplier power.
Barriers to New Entrants
- Infrastructure
- The foremost barrier for a new entrant is resources and capital cost required to start a plant. It is in addition to labor, transportation, and warehousing
- Brand Differentiation
- Though there is a potential for a new entrant to compete head-to-head with key players, brand differentiation strengthens the new entrant only to a limited extent, especially for semi-conductors
- Switching Cost
- Customers find it challenging to switch from one supplier to a new entrant by changing the entire design
Intensity of Rivalry
- Product Differentiation and Contractual Terms
-
Intense competition in the industry, with few differentiated service offerings are the main factors for high industry rivalry
-
Flexible contractual terms are being used to attract customers
-
The pressure remains with all the tier-2 players in the industry
-
Exit barriers for big players are also high, due to high cost of entry into the market
Threat of Substitutes
- Switching Cost
-
For semi-conductors, high switching cost is involved that makes it difficult for substitutes to draw customers away from key players
-
For passives and interconnects, the switching cost is low, as there could be very similar passive component or interconnect that can substitute the existing product
- Performance to Price Ratio
- The switching cost differs for different electronic components, the low performance to price ratio of substitutes exerts a weak force in the industry environment
Buyer Power
- Total Spend
- With the ever-increasing buyer spend on electronic components, the buyer’s ability to bargain and obtain value-added services is high
- Contracts
-
For semi-conductors, supplier alliances are formed in a long-term basis, so buyer’s power is generally high during long-term over short-term
-
There is a mild backward integration risk, due to large entry barriers. For passives & interconnects, they generally focus on procurement from distributors rather than suppliers for commoditized products
Interesting Reads:
Discover the world of market intelligence and how it can elevate your business strategies.
Learn more about how market intelligence can enable informed decision-making, help identify growth opportunities, manage risks, and shape your business's strategic direction.
Get Ahead with AI-Enabled Market Insights Schedule a Demo Now