CATEGORY
LPG
Beroe LiVE.Ai™
AI-powered self-service platform for all your sourcing decision needs across 1,200+ categories like LPG.
Market Data, Sourcing & Supplier Intelligence, and Price & Cost Benchmarking.
Schedule a DemoLPG Market Monitoring Dashboard
Understand the correlation between costs, margins, and prices impacting your category on a real time basis on Beroe LiVE.Ai™
Schedule a DemoLPG Industry Benchmarks
Savings Achieved
(in %)
The average annual savings achieved in LPG category is 6.31%
Payment Terms
(in days)
The industry average payment terms in LPG category for the current quarter is 49.4 days
Compare your category performance against peers and industry benchmarks across 20+ parameters on Beroe LiVE.Ai™
Category Strategy and Flexibility
Engagement Model
Supply Assurance
Sourcing Process
Supplier Type
Pricing Model
Contract Length
SLAs/KPIs
Lead Time
Supplier Diversity
Targeted Savings
Risk Mitigation
Financial Risk
Sanctions
AMEs
Geopolitical Risk
Cost Optimization
Price per Unit Competitiveness
Specification Leanness
Minimum Order Quality
Payment Terms
Inventory Control
The World’s first Digital Market Analyst
Abi, the AI-powered digital assistant brings together data, insights, and intelligence for faster answers to sourcing questions
Abi is now supercharged with GPT4 AI engine. Enjoy the ease of ChatGPT, now on Abi
LPG Suppliers
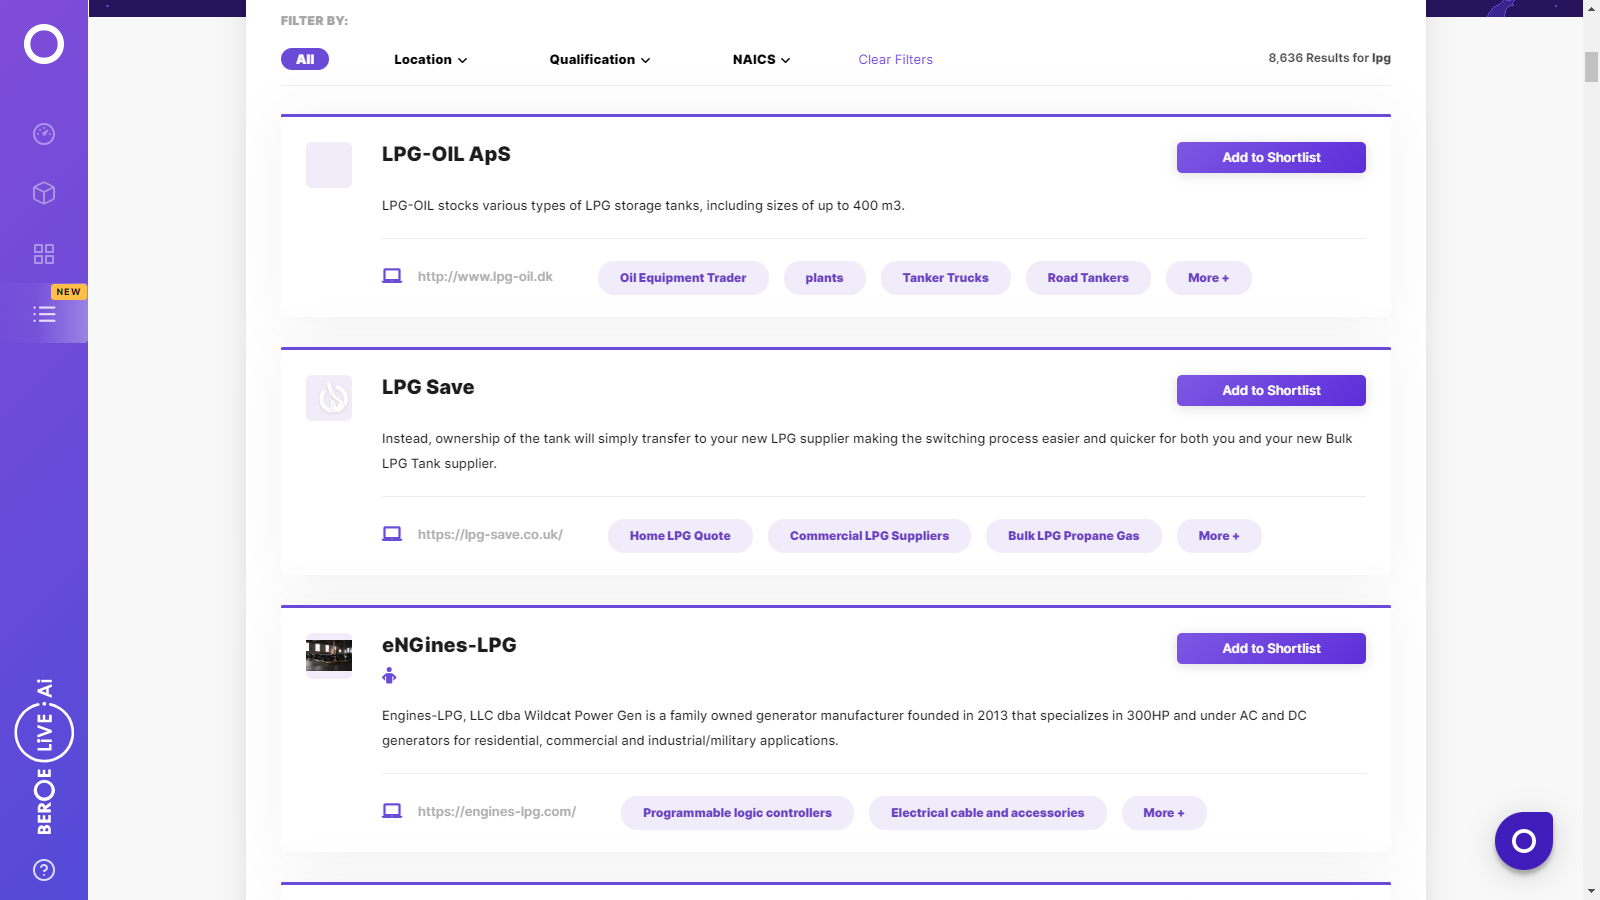
Find the right-fit lpg supplier for your specific business needs and filter by location, industry, category, revenue, certifications, and more on Beroe LiVE.Ai™.
Schedule a Demo

Use the LPG market, supplier and price information for category strategy creation and Quaterly Business Reviews (QRBs)
Schedule a DemoLPG market report transcript
LPG Global Market Outlook
-
The global production of LPG is expected to increase by 1–3 percent in 2022, to reach around 334 million tons
-
The increase in demand for LPG’s substitute naphtha for the industrial sector application can keep the production growth rate to a minimum level
-
The restored commercial and transport activities after the lifting of lockdown impositions will help in the demand of LPG compared to previous year
Impact of COVID-19 on LPG Industry
-
The LPG category has recovered from a significant impact, as industrial demand has recovered. The expected winter demand, increasing gas usage for heating applications, also acts as a relief for the sector.
-
The oil & gas companies have faced problems, due to supply chain disruption, with travel impositions and reduced industrial output globally, due to the lockdown effect.
-
The demand for LPG has reduced in 2020 and partly in 2021, amid COVID-19 pandemic
-
The reduced demand is mainly due to the less industrial activities, amid COVID-19, due to the lockdown impositions that came in to force to restrict the spread of virus
Porter’s Five Forces Analysis on LPG Industry
Supplier Power
-
Supplier Base: The oil & gas industry has a considerable supplier base, ranging from private companies to state run national oil companies
-
The vertical integration of oil & gas companies is similar to that of its major competitors. This makes the bargaining power of supplier to be medium
Barriers to New Entrants
-
Capital-intensive Industry: The oil & gas industry requires huge capitals for building its infrastructure, which includes pipelines, machinery, drilling wells, acquiring land, etc.
-
Considering the cost of market entry, the barriers to new entry is high
Intensity of Rivalry
-
Consolidated market : The oil & gas sector is dominated by vertical integration companies that produce a number of low differentiated products, like LPG, petrol, etc.
-
The key competitors are also established well with significant client base. This coupled with threat of new entrants to be low, makes the intensity of rivalry to be high
Threat of Substitutes
-
Feedstock for petrochemical sector: Propane and naphtha are used to crack by petrochemical companies to produce Ethylene. The companies tend to lean towards naphtha, as it also produces other products, like propylene, benzene, etc.
-
When the propane-naphtha spread dips below -$60/ton, it is more economical for the industry to crack Propane, which makes threat of substitute to be medium
Buyer Power
-
Similar products: The products offered by the oil & gas companies are similar to that of those supplied by their competitors. This enables buyers to choose companies selling the products with lower prices or better terms
-
On a flip side, due to the presence of huge number of buyers, the supplier’s operations would not be impacted greatly if buyers opt for the competitor. Hence, it can be treated as medium
Interesting Reads:
Discover the world of market intelligence and how it can elevate your business strategies.
Learn more about how market intelligence can enable informed decision-making, help identify growth opportunities, manage risks, and shape your business's strategic direction.
Get Ahead with AI-Enabled Market Insights Schedule a Demo Now