CATEGORY
Electricity Market: Japan and China
The report covers in detail the market supply demand dynamics, supplier landscape, pricing analysis and procurement best practices across the industries for Japan & China Electricity Market
Beroe LiVE.Ai™
AI-powered self-service platform for all your sourcing decision needs across 1,200+ categories like Electricity Market: Japan and China.
Market Data, Sourcing & Supplier Intelligence, and Price & Cost Benchmarking.
Schedule a DemoThe World’s first Digital Market Analyst
Abi, the AI-powered digital assistant brings together data, insights, and intelligence for faster answers to sourcing questions
Abi is now supercharged with GPT4 AI engine. Enjoy the ease of ChatGPT, now on Abi
Electricity Market: Japan and China Suppliers
Find the right-fit electricity market: japan and china supplier for your specific business needs and filter by location, industry, category, revenue, certifications, and more on Beroe LiVE.Ai™.
Schedule a Demo

Use the Electricity Market: Japan and China market, supplier and price information for category strategy creation and Quaterly Business Reviews (QRBs)
Schedule a DemoElectricity Market: Japan and China market report transcript
Japanese Electricity Market: Current Structure
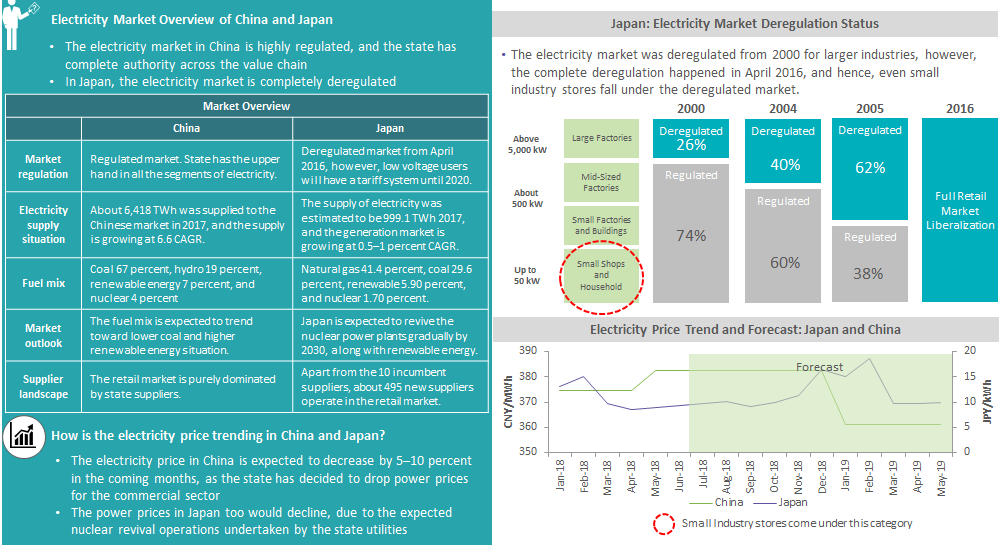
Currently, the Japanese electricity market is highly regionalized with 10 vertically integrated companies, which dominate the electricity sector, and only Tepco has initiated the unbundling process, while other nine players are expected to unbundle by 2020.
 Electricity Supply and Consumption Analysis: Japan
The electricity supply is dominated by the 10 incumbent suppliers, about 90 percent of the market, and the rest by the newly entered generation companies. The electricity supplied in Japan is majorly consumed by industrial consumers, and commercial consumers, like Industry, consume about 4 percent of the total supply.
- The electric supply has been 994.1 TWh during 2016, and the electricity supply is likely to grow by about 0.5–1 percent Y-o-Y
- The electricity supply during 2015 had tremendously dropped to a 17-year low, mainly due to economic slowdown and efficiency measures undertaken by the consumers
- The supply is dominated by the top 10 suppliers, about 90 percent who are vertically integrated in their own region of operation
- However, these incumbent suppliers will legally unbundle into different companies by 2020, when the final deregulation is in effect
- The major electricity consumers in Japan are industrial consumers, about 62 percent who after 2004 was completely deregulated and had the option to choose their own supplier
- The residential sector is the next dominant player, when it comes to electricity consumption, and they consume about 33 percent of the total electricity sold in the country
- The commercial consumers, like industry, consume about 4 percent of the electricity, and the market consisting of low voltage commercial consumers and residential, about $67 billion in size, has been deregulated
Electricity Generation Capacity and Outlook: China
The electricity generation capacity had been growing at a CAGR of 9 percent, and solar energy had the highest share among them, about 68 percent Y-o-Y growth between 2016 and 2017.
- The electricity generation capacity has been growing at a pace of nearly 5–9 percent CAGR, and it is likely to continue for the coming two years
- Among the capacity additions, renewable energy, especially solar power, had grown tremendously, and a Y-o-Y addition of capacity from 2016 to 2017 was above 21 GW
- However, the capacity additions have been slower at the coal power plant front, and in fact, the capacity dropped by 3,613 MW, about 9 percent Y-o-Y dip
- Transmission losses are at 6.2 percent currently, which is lower than the world's average of 8 percent, and it is expected that the loss will remain at a level of 6 percent by 2019
Interesting Reads:
Discover the world of market intelligence and how it can elevate your business strategies.
Learn more about how market intelligence can enable informed decision-making, help identify growth opportunities, manage risks, and shape your business's strategic direction.
Get Ahead with AI-Enabled Market Insights Schedule a Demo Now