CATEGORY
Polyethylene
Polyethylene is the largest polymer that finds its use in food/non-food packaging, agriculture (pipes, films), automotives, construction, household and recreational products. Global polyethylene demand is estimated to grow at 3.53 percent CAGR between 2016-2021, driven by increasing demand from Asian markets.
Beroe LiVE.Ai™
AI-powered self-service platform for all your sourcing decision needs across 1,200+ categories like Polyethylene.
Market Data, Sourcing & Supplier Intelligence, and Price & Cost Benchmarking.
Schedule a DemoThe World’s first Digital Market Analyst
Abi, the AI-powered digital assistant brings together data, insights, and intelligence for faster answers to sourcing questions
Abi is now supercharged with GPT4 AI engine. Enjoy the ease of ChatGPT, now on Abi
Polyethylene Suppliers
Find the right-fit polyethylene supplier for your specific business needs and filter by location, industry, category, revenue, certifications, and more on Beroe LiVE.Ai™.
Schedule a Demo

Use the Polyethylene market, supplier and price information for category strategy creation and Quaterly Business Reviews (QRBs)
Schedule a DemoPolyethylene market frequently asked questions
Asia is known to be the key demand driver for the polyethylene market as it fairly contributes to the increase in per capita consumption and shows an expected growth rate of 4.4 percent.
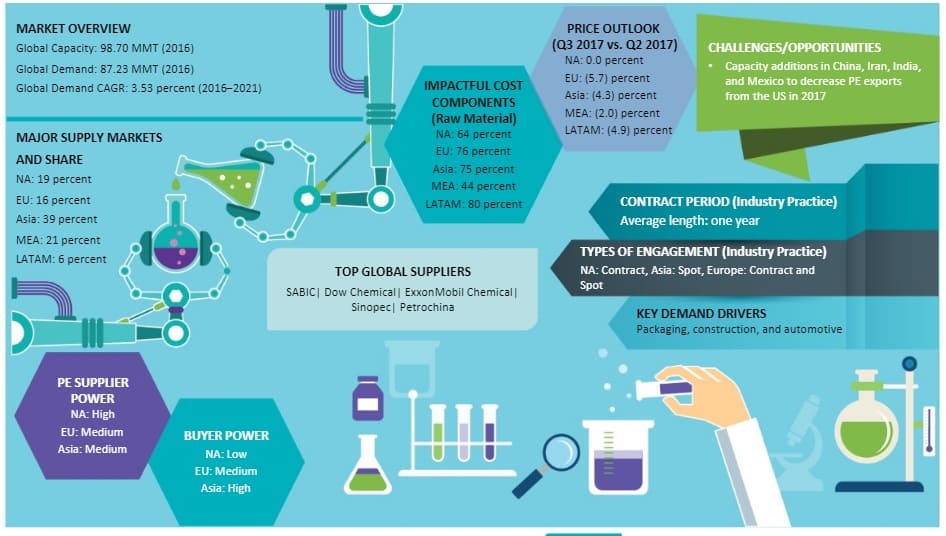
As per the polyethylene market outlook report, the major share of the global polyethylene market is from the North American region capturing 20 percent of the share. It is followed by the EU with 16 percent, Asia with 39 percent, MEA with 20 percent, and LATAM region with just 5 percent share.
Amongst North America, Europe, and the APAC region, the highest production of polyethylene comes from Europe with 44.6 MMT size. Europe is followed by North America with a production size of 25.0 MMT and then by the APAC region with a production of 18.2 MMT.
As per Beroe's report, the top suppliers of the polyethylene market are: SABIC Exxon Mobil Dow Chemical SINOPEC Petrochina
The average acceptable length of contract in the polyethylene market is one year.
According to the data report generated by Beroe, the price outlook for the polyethylene market took a considerable shift across regions when Q2 of one year and Q3 of next year were compared. The insights are as follows: NA: 0.0 percent EU: 5.7 percent Asia: 4.3 percent MEA: 2.0 percent LATAM: 4.9 percent
As per Beroe's analysis, capacity addition in China, Iran, India, and Mexico to decrease the PE exports from the US region is the biggest challenge/opportunity that is being faced by the suppliers in the polyethylene market.
As per the polyethylene market analysis report shared by Beroe, the global capacity, global demand, and global demand CAGR of the polyethylene market stands at a valuation of 98.70 MMT, 87.23 MMT, and 3.53 percent respectively.
There are two forms of engagement widely accepted as industry standards within the polyethylene industry. The engagement forms are: Contract Spot These two engagement forms are bifurcated within regions as: North America region: Contract Asia: Spot Europe: Contract and Spot
Polyethylene market report transcript
Global Market Outlook on Polyethylene
- The global polyethylene market is expected to grow at 3.2% CAGR during 2017–2022.
- Market growth in the Asia Pacific (APAC) will follow a robust trajectory. Asia will remain the key demand driver with a projected growth rate of 4.4% owing to rising per capita consumption.
- Blow molding applications and food/non-food packaging applications will be the key segments that will drive the market growth across the regions.
- North America holds the major global polyethylene market share with 20%, followed by European Union (EU): 16%, Asia: 39%, Middle East and Africa (MEA): 20%, and Latin America (LATAM): 5%.
- The top polyethylene suppliers are SABIC, ExxonMobil Chemical, Dow Chemical, Sinopec, and Petrochina.
- The polyethylene market analysis reveals that films used for packagings (food and non-food) such as LDPE films, LLDPE films, and cast films, and non-packaging account for over half of the global PE demand.
- The COVID-19 pandemic has led to calls for action from several stakeholders such as vendors, producers, distributors, and consumers. Business standstills for at least three months during 2020 in tandem with reduced demand from a couple of key markets have put a dent in the revenue pool of PE producers and distributors. However, this report on the polyethylene market trend underlines that the COVID-19 impact on polyethylene will be compensated over the medium-to-long term.
Demand Market Outlook
- The Middle East and North America are the supply surplus regions, while Asia, LATAM, and Europe are the trade deficit regions. The trend is broadly expected to continue until 2022.
- In APAC, demand for polyethylene films will majorly come from the construction and packaging industries.
- In Europe, the automotive industry is driving the demand for these extruded films.
- In North America, the polyethylene market is primarily driven by healthcare, packaging, automotive, and electrical & electronics industries.
Global Market Size: PE
- The global PE market was valued at $152 Bn in 2016 and is estimated to touch $190 Bn by 2022, growing at a CAGR of 3.8 percent.
- Asia will likely witness a high growth rate of about 4.4% CAGR, followed by the Middle East, ranging from 4-5% CAGR, while saturated markets such as the US are expected to witness a 2–3% CAGR during 2017–2022.
- Markets in Europe and LATAM will grow at 1.2% and 2.3% during the forecast period respectively.
Global Capacity–Demand Analysis
- The increase in new capacities to the tune of 33-34 MMT by 2021 and modest demand growth rates of 3.2 percent CAGR are likely to keep the market well supplied.
- An increase in new capacities by over 6 MMT in China, the largest demand center, could reduce the supply-demand gap. Thereby, leaving CPG buyers with more domestic sourcing options. However, Asia would continue to be a net importer of PE.
- Likewise, an increase in new capacities in the US could lead to increased exports into LATAM, China, and African countries.
Market Outlook
- An abundance of low-cost ethane in the US has been driving PE capacity expansions in the U.S. as well as in Canada, where over 10 MMT new capacity would be online by 2021.
- Lifting of sanctions on Iran will drive new PE capacity additions in the country.
- Due to stringent environmental regulations in China, the country has scrapped "coal to olefins plants" and has started investing in imported ethane-based crackers.
- Europe’s recycling targets: The European Union (EU) has set its targets for recycling to over 40% by 2025 in a bid to curb the demand for virgin PE.
- Price movements of ethylene have a considerable impact on the resin production cost and margins.
- Price analysis forecasts that the American polyethylene market price was expected to decrease by 0–1% in Q3 2019 on a Q-o-Q basis.
- The prices were expected to decrease by 1–2% on a Q-o-Q basis in Europe.
- The global polyethylene market incorporates several manufacturers that are aiming to surpass their peers in terms of value by rolling out leading-edge polythene products derived from film extrusion. Other players are entering into collaborations to develop such products.
Engagement Outlook
- The North American market is predominantly contract-based, and buyers prefer to source locally, due to the higher cost of imported PE.
- Contracts are generally renewed annually.
- In Asia, buyers engage in spot buying and source both within the region or from Europe/Asia, if arbitrage opportunities are available.
- In Europe, the buyers’ source both within the region and from Asia/Middle East. Both spot and contract prices are used.
- The suppliers are willing to enter into a contract, only if the minimum order volume is over 1,000 MT or sometimes over 2,000 MT.
Market Overview
- An abundance of low-cost ethane in the US has been driving PE capacity expansions in the US and Canada, where over 10 MMT new capacity would be online by 2021.
- Lifting of sanctions on Iran will drive new PE capacity additions in Iran.
- Due to stringent environmental regulations in China, the country has scrapped "coal to olefins plants" and has started investing in imported ethane-based crackers.
- Europe’s recycling targets: The European Union has set its targets for recycling to over 40 percent by 2025, which is expected to curb the demand for virgin PE in the market.
- Price movements of ethylene have a considerable impact on the resin production cost and margins.
- Price analysis forecasts that the American polyethylene market price was expected to decrease by 0–1 percent in Q3 2019 on a Q-o-Q basis.
- The prices were expected to decrease by 1–2 percent on a Q-o-Q basis in Europe.
Why You Should Buy This Report
- Regional market analysis, supply-trend analysis, industry drivers and constraints, cost structure, and pricing analysis of the polyethylene market.
- Provides supplier profile and SWOT analysis of major polyethylene suppliers like Exxon Mobil, SABIC, etc.
- It lists out the best industry practices and pricing structures.
- Get strategic assessment through drivers, trends, opportunities, challenges, and Porter's five forces analysis.
- Discover potential strategies of market leaders, as well as various market developments including new product launches, M&As, and competitive analysis.
Interesting Reads:
Discover the world of market intelligence and how it can elevate your business strategies.
Learn more about how market intelligence can enable informed decision-making, help identify growth opportunities, manage risks, and shape your business's strategic direction.
Get Ahead with AI-Enabled Market Insights Schedule a Demo Now