CATEGORY
Fracking Proppants
Fracking proppant is a solid material, typically sand, treated sand or man-made ceramic materials, designed to keep an induced hydraulic fracture open, during or following a fracturing treatment
Beroe LiVE.Ai™
AI-powered self-service platform for all your sourcing decision needs across 1,200+ categories like Fracking Proppants.
Market Data, Sourcing & Supplier Intelligence, and Price & Cost Benchmarking.
Schedule a DemoFracking Proppants Market Monitoring Dashboard
Understand the correlation between costs, margins, and prices impacting your category on a real time basis on Beroe LiVE.Ai™
Schedule a DemoFracking Proppants Industry Benchmarks
Savings Achieved
(in %)
The average annual savings achieved in Fracking Proppants category is 16.40%
Payment Terms
(in days)
The industry average payment terms in Fracking Proppants category for the current quarter is 45.0 days
Compare your category performance against peers and industry benchmarks across 20+ parameters on Beroe LiVE.Ai™
Category Strategy and Flexibility
Engagement Model
Supply Assurance
Sourcing Process
Supplier Type
Pricing Model
Contract Length
SLAs/KPIs
Lead Time
Supplier Diversity
Targeted Savings
Risk Mitigation
Financial Risk
Sanctions
AMEs
Geopolitical Risk
Cost Optimization
Price per Unit Competitiveness
Specification Leanness
Minimum Order Quality
Payment Terms
Inventory Control
The World’s first Digital Market Analyst
Abi, the AI-powered digital assistant brings together data, insights, and intelligence for faster answers to sourcing questions
Abi is now supercharged with GPT4 AI engine. Enjoy the ease of ChatGPT, now on Abi
Fracking Proppants Suppliers
Find the right-fit fracking proppants supplier for your specific business needs and filter by location, industry, category, revenue, certifications, and more on Beroe LiVE.Ai™.
Schedule a Demo

Use the Fracking Proppants market, supplier and price information for category strategy creation and Quaterly Business Reviews (QRBs)
Schedule a DemoFracking Proppants market report transcript
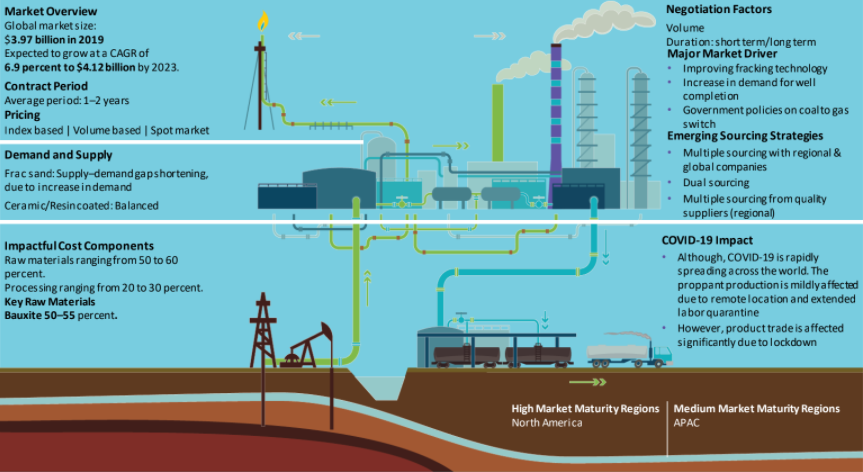
Global Proppants Market Outlook
-
The global market for fracking proppants is estimated to be $12.27 billion in 2023
-
By 2026, it is expected to reach $16 billion with a CAGR of 6 percent, owing to high CAPEX spending in the upstream sector and the growing number of oil wells
-
Frac sand is a mined commodity. Only a few suppliers have their own mines, whereas few oil and gas operators have invested in in-house sand mining to meet their requirements at a cheaper rate
Fracking Proppants Demand Forecast 2024: Global
-
In terms of volume, the global proppants market was estimated to be 31 million tons in 2023, and it is expected to grow at a CAGR of 8 percent to reach 39 million tons by the end of 2026
-
North America accounts for approx. 80 percent of the global proppants market. As oil prices increased, US drillers are facing difficulty to find sand for fracking
-
The APAC accounts for approx. 16 percent of the global proppants market, and it is expected to witness an increase in H1 2023
Global Proppants Market
Global Proppant Market by Type: 2022 (by volume)
-
Frac sand accounts for approx. 87 percent by volume and approx. 85 percent by value of the overall proppants market and is expected to dominate the market (in volume), due to its availability and low price
-
Ceramic proppants account for approx. 8 percent by volume and approx. 9 percent by value of the overall proppants market, and it is expected to increase marginally, due to its superior quality, physical properties, and stability to other types of proppants
-
Resin coated proppants account for ~5 percent by volume and ~6 percent by value of the overall proppants market, and it is expected to increase marginally, due to its excellent physical properties, however, its high cost could limit the volume growth
Proppants Market by Region: 2022*
-
North America is the most mature market for proppants
-
China is the largest market in the APAC region and a net exporter of ceramic proppants, and it is expected to remain the largest, due to the increase in the domestic demand for LNG from the unconventional shale and CBM exploration, owing to China’s policy of coal to gas switch
-
India and Australia are the second and third largest markets in the APAC region. However, the Indian market is expected to impact positively in H1 2023
-
Russia, one of the key exporters of Frac sand to the North American region, is now being banned by the Americas and Europe, due to its invasion of Ukraine and this imposed a major supply gap in the market, which the nations are trying to overcome by becoming independent producers and by making use of alternate supplies
Fracking Proppant: Regional Market Outlook
-
North America holds the major share of the global proppant market in 2023. An increase in investment for oil production and technological advancement are the major driver for fracking proppant in the region
-
The APAC region is expected to be the fastest growing region for fracking proppant during 2022–2026, due to an increase in investment in the oil and gas activities in the region
Global Proppants Drivers and Constraints
Drivers
- Increase in demand for well completion activities in the North American market and rebounding of oil price are the key market drivers for proppants
Increase in production from unconventional fields
-
Increased focus on resource recovery has led to the adoption of high-volume usage of proppants per well and use of more efficient proppant mix for the fracking process
-
Improvement in fracking technology is viewed as the key growth driver for proppants demand
Rise in rig count
-
The rig count in the US has been rising, which can positively increase the demand for proppant
Increase in US fracking activities
-
Considering the existing high oil prices, major fracking companies have started fracking operations once again in the US
Government policy
-
With the recent China’s policy of coal-to-gas switch has increased the demand for LNG, which, in turn, increased the demand for proppants, while the shale gas exploration increased in the above-mentioned region
Constraints
-
Oil price volatility, regulations on environmental concerns and constrained production from suppliers are the key challenges affecting the growth of proppants market
Environmental regulations
-
Stringent government and environmental concerns are constraints to the growth of proppant markets
Lower profit margins
-
With the increase in input costs, the supplier margins are comparatively lower in percentage
Oil price volatility
-
Even though the oil prices remain high, the volatile nature of the industry poses a threat to the fracking proppant market
Oil and Gas Companies Bankruptcies
-
According to Haynes & Bones, around 40 E&P companies and 44 oilfield services companies have filed for bankruptcy, which had significantly impacted the market in the previous years, leading to a consolidated number of buyers in the market
Why You Should Buy This Report
The report provides information about the global and regional proppants market with a regional snapshot of the proppant industry in India, North America, etc. It provides the cost breakup of proppants and explains the best industry practices. The report lists out the industry drivers and constraints and gives key profile of global proppant suppliers like U.S. Silica, Hi Crush Partners LP, Hexion Inc., etc.
Interesting Reads:
Discover the world of market intelligence and how it can elevate your business strategies.
Learn more about how market intelligence can enable informed decision-making, help identify growth opportunities, manage risks, and shape your business's strategic direction.
Get Ahead with AI-Enabled Market Insights Schedule a Demo Now