CATEGORY
Floating Production Storage and Offloading (FPS & FPSO)
FPSO'sare floating vessel used in the offshore oil and gas industry for production, processing and storage of hydrocarbons. These are viable solution for number of offshore field situations
Beroe LiVE.Ai™
AI-powered self-service platform for all your sourcing decision needs across 1,200+ categories like Floating Production Storage and Offloading (FPS & FPSO).
Market Data, Sourcing & Supplier Intelligence, and Price & Cost Benchmarking.
Schedule a DemoCategory Alerts
Brazilian Offshore Field Enauta Connects New Well to FPSO Petrojarl I
March 29, 2023Energean is looking at possibilities to boost the FPSO vessel's capacity to 12 billion cubic metres (bcm) annually off the coast of Israel.
March 27, 2023A short -term extension has been agreed by BW Offshore for the Espoir Ivoirien FPSO and the Abo FPSO.
April 03, 2023Become a Beroe LiVE.Ai™ Subscriber to receive proactive alerts on Floating Production Storage and Offloading (FPS & FPSO)
Schedule a DemoFloating Production Storage and Offloading (FPS & FPSO) Market Monitoring Dashboard
Understand the correlation between costs, margins, and prices impacting your category on a real time basis on Beroe LiVE.Ai™
Schedule a DemoFloating Production Storage and Offloading (FPS & FPSO) Industry Benchmarks
Savings Achieved
(in %)
The average annual savings achieved in Floating Production Storage and Offloading (FPS & FPSO) category is 16.40%
Payment Terms
(in days)
The industry average payment terms in Floating Production Storage and Offloading (FPS & FPSO) category for the current quarter is 45.0 days
Compare your category performance against peers and industry benchmarks across 20+ parameters on Beroe LiVE.Ai™
Category Strategy and Flexibility
Engagement Model
Supply Assurance
Sourcing Process
Supplier Type
Pricing Model
Contract Length
SLAs/KPIs
Lead Time
Supplier Diversity
Targeted Savings
Risk Mitigation
Financial Risk
Sanctions
AMEs
Geopolitical Risk
Cost Optimization
Price per Unit Competitiveness
Specification Leanness
Minimum Order Quality
Payment Terms
Inventory Control
The World’s first Digital Market Analyst
Abi, the AI-powered digital assistant brings together data, insights, and intelligence for faster answers to sourcing questions
Abi is now supercharged with GPT4 AI engine. Enjoy the ease of ChatGPT, now on Abi
Floating Production Storage and Offloading (FPS & FPSO) Suppliers
Find the right-fit floating production storage and offloading (fps & fpso) supplier for your specific business needs and filter by location, industry, category, revenue, certifications, and more on Beroe LiVE.Ai™.
Schedule a Demo

Use the Floating Production Storage and Offloading (FPS & FPSO) market, supplier and price information for category strategy creation and Quaterly Business Reviews (QRBs)
Schedule a DemoFloating Production Storage and Offloading (FPS & FPSO) market frequently asked questions
As per Beroe's FPSO market forecast, the FPSO market share is expected to reach $44.12 billion by 2022.
The major players in the floating production storage and offloading market are South America (28.6%), Asia (27.6%), Africa (21%), Europe (14.7%), Australia (4.5%), Middle East (1.5%), and North America (1.5%).
The latest FPSO market trends are that the global market is dominated by a few major players whereas NOCs have their own FPSOs, the biggest barriers to new emerging players in the market are hiring an experienced crew, and supply and demand are the key drivers for price change in the market.
The FPSO market forecast in terms of estimated growth is about 14.42% CAGR.
The key demand drivers for the floating production storage and offloading market are rise in crude oil prices and new deep water asset discovery.
Floating Production Storage and Offloading (FPS & FPSO) market report transcript
Global Market Outlook on Floating Production Storage and Offloading
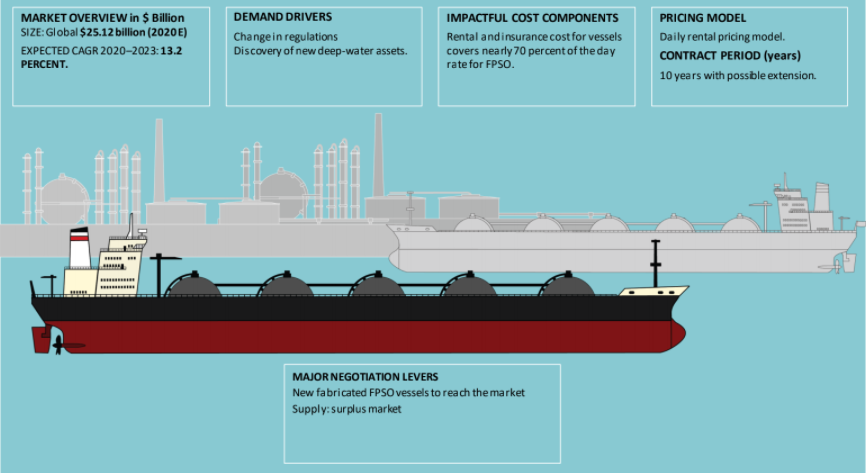
MARKET OVERVIEW in $ Billion
SIZE: Global $35.17billion (2023 E)
EXPECTED CAGR 2023–2026: 11.09 PERCENT.
-
Latin America is the largest market for FPSO, with a market share of more than 31 percent, followed by APAC and Africa with 30 percent and 22 percent, respectively, for 2023
-
Development of new offshore fields is the key driver for the FPSO demand in the African region
FPSO Market: Global and Regional
-
The global FPSO market is expected to reach $49.06 billion by 2026, with a CAGR of 11.09 percent. The discovery of deep-water assets in offshore Africa, Brazil, and Guyana will be driving the demand for FPSO in the forecast period
FPSO Demand Forecast 2023–2026: Global
-
The global oil & gas FPSO demand market is estimated to be $35.17 billion in 2023, it is forecasted to reach $49.06 billion by 2026, with an estimated CAGR of 11.09 percent
-
A huge backlog of deepwater projects has grown, and orders for production floaters are once again being placed at historically high rates. Over the next decade, it is estimated that more than 200 projects are currently in the planning phase will need a floating production system for field development. The backlog includes about 60 projects that will require an FPSO during the next five years.
-
A major constraint will be the supply chain's capacity to absorb the large number of contracts for new floating production systems throughout this short time period
-
There are now 209 floating production units, 163 are operating, 16 in available position and 30 on order
Global FPSO Market Size by Region: 2023
-
South America is expected to remain a key region for high-impact exploration, especially in the Suriname-Guyana Basin and offshore Brazil, while Argentina will witness the drilling of its first-ever deepwater well
-
Producers and developers have recently made a series of announcements, which suggests that E&P activities in the Gulf of Mexico may finally be on the rise once more. Independents and mid-sized operators are driving these efforts by pushing forward with engineering studies, drilling plans, and field development plans that are scheduled for implementation in the fourth quarter of 2022 or the first half of 2023.
FPSO Demand by Countries: 2022
-
China, the UK, Nigeria, and Angola collectively constitute to more than 31 percent of the FPSO demand on a country level
-
In North America, activity is anticipated to pick up after a slow year in which nine high-impact wells were completed. Further, there will be additional commitment wells offshore Mexico, over five high-impact wells in the U.S. Gulf of Mexico, and a significant frontier basin test in the Orphan Basin offshore Canada.
-
Brazil is currently the largest market for FPSOs with 48 installed units, Brazil is highly lucrative for the FPSO market on a country level. This is due to an increase in offshore activities in the country and new regulations in favor of oil companies
FPSO Demand by Oil Companies: 2022
-
Petrobras, CNNOC, Total are the major buyers of FPSO service, and they constitute to 40 percent of the global demand
-
Petrobras is the single largest operator of FPSO vessels globally with more than 20 percent of market share
-
Other major oil companies, namely CNOOC, Total, Chevron, Exxon, and Shell, also have a major share in the FPSO market
-
The rest of the fleet is operated by independent and smaller oil companies
Growth Drivers
New offshore discoveries, increase in spend from E&P companies, and changes in regulations are set to drive the demand for FPSO.
New offshore discoveries and development
-
New discoveries of deep-water fields in offshore of Africa, Brazil, and Guyana are the key drivers for the demand of FPSO
-
Offshore Guyana is forecasted to have a demand for five FPSOs, as estimated recoverable resources have risen by 25 percent
Changes in regulations
-
New energy policy enacted by the Brazilian government to increase production from pre-salt basins in offshore
-
This is likely to increase the demand by 30 percent in the Brazilian market alone
Growth Constraints
-
Environmental concerns and increase in day rates are the hindrance in developing the offshore assets
Environment concerns
-
Increase in environmental concern in developing the offshore assets is seen as the hindrances by oil companies
Increase in FPSO day rates
-
Following the increase in demand, the day rates of FPSO are expected to increase
Russia–Ukraine conflict and oil prices
-
Oil prices have remained high barrel since the start of the Russian invasion of Ukraine, and the majority of offshore rig contractors do not anticipate an immediate increase in demand
-
However, improving economic recoveries across geographies have increased the demand for crude and oil prices. Hence, FPSOs are expected to be back in limelight to make up for the crude oil demand requirements
FPSO Cost & Pricing Analysis
This section of the report details the cost of having a floating production offloading vessel or converted storage tanker and helps one understand the financial advantages and disadvantages of having one. The cost structure analysis of FPSO helps one understand the breakup of the expenditure on an FPSO. One can understand the nuances of the expenditure on an FPSO and be able to understand what the actual cost will work out to be. The report also gives details of the contract models that are followed in the industry. It is informative about the different advantages of each contract model for an offshore storage unit and the geographies in which each is more popular.
FPSO Market Trends and Innovations
Noteworthy technological advancements that impact offshore oil & gas production and the floating processing vessel and floating storage offloading vessel market are detailed in this section of the report. This includes any proprietary or patented technology that has made an impact. The crude industry is also constantly improving the efficiency, safety, and sustainability aspects of offshore oil & gas storage and production, and the key improvements and trends in cost-effectiveness, sustainability and safety of offshore oil & gas processing are presented.
FPSO Market Overview
- Low utilization rate, medium demand, and low day rates of floating production storage offloading have reduced the bargaining power of the supplier.
- The global market is consolidated with few numbers of global players, while several NOCs have their own fleet of FPSOs
- Hiring an experienced crew is likely to be the biggest barrier for new entrants into the FPSO market.
- Supply-demand tends to be the key price driver for FPSO day rates.
- Given the increase in oil price, day rates of FPSO companies are forecasted to increase as E&P companies are working to improve the production levels.
- Larger FPSOs, with high production and processing facilities, tend to have a high charter rate, due to cost-efficiency factors.
- Ownership nature of FPSO, sourcing market and vendor selection are the key considerations to engage with the FPSO supplier.
- Charter type, commercial model and contract duration are the three key factors in selecting a cost-effective FPSO solution.
Why Should You Buy This Report
- Information about the profile and service capability of suppliers like MODEC, SBM Offshore, BW Offshore, etc.
- Best sourcing strategies and procurement practices in the FPSO market.
- Constraints, drivers and Porter’s five force analysis of the FPSO industry.
Interesting Reads:
Discover the world of market intelligence and how it can elevate your business strategies.
Learn more about how market intelligence can enable informed decision-making, help identify growth opportunities, manage risks, and shape your business's strategic direction.
Get Ahead with AI-Enabled Market Insights Schedule a Demo Now