CATEGORY
Completion Chemicals
Beroe LiVE.Ai™
AI-powered self-service platform for all your sourcing decision needs across 1,200+ categories like Completion Chemicals.
Market Data, Sourcing & Supplier Intelligence, and Price & Cost Benchmarking.
Schedule a DemoCompletion Chemicals Market Monitoring Dashboard
Understand the correlation between costs, margins, and prices impacting your category on a real time basis on Beroe LiVE.Ai™
Schedule a DemoCompletion Chemicals Industry Benchmarks
Savings Achieved
(in %)
The average annual savings achieved in Completion Chemicals category is 16.40%
Payment Terms
(in days)
The industry average payment terms in Completion Chemicals category for the current quarter is 45.0 days
Compare your category performance against peers and industry benchmarks across 20+ parameters on Beroe LiVE.Ai™
Category Strategy and Flexibility
Engagement Model
Supply Assurance
Sourcing Process
Supplier Type
Pricing Model
Contract Length
SLAs/KPIs
Lead Time
Supplier Diversity
Targeted Savings
Risk Mitigation
Financial Risk
Sanctions
AMEs
Geopolitical Risk
Cost Optimization
Price per Unit Competitiveness
Specification Leanness
Minimum Order Quality
Payment Terms
Inventory Control
The World’s first Digital Market Analyst
Abi, the AI-powered digital assistant brings together data, insights, and intelligence for faster answers to sourcing questions
Abi is now supercharged with GPT4 AI engine. Enjoy the ease of ChatGPT, now on Abi
Completion Chemicals Suppliers

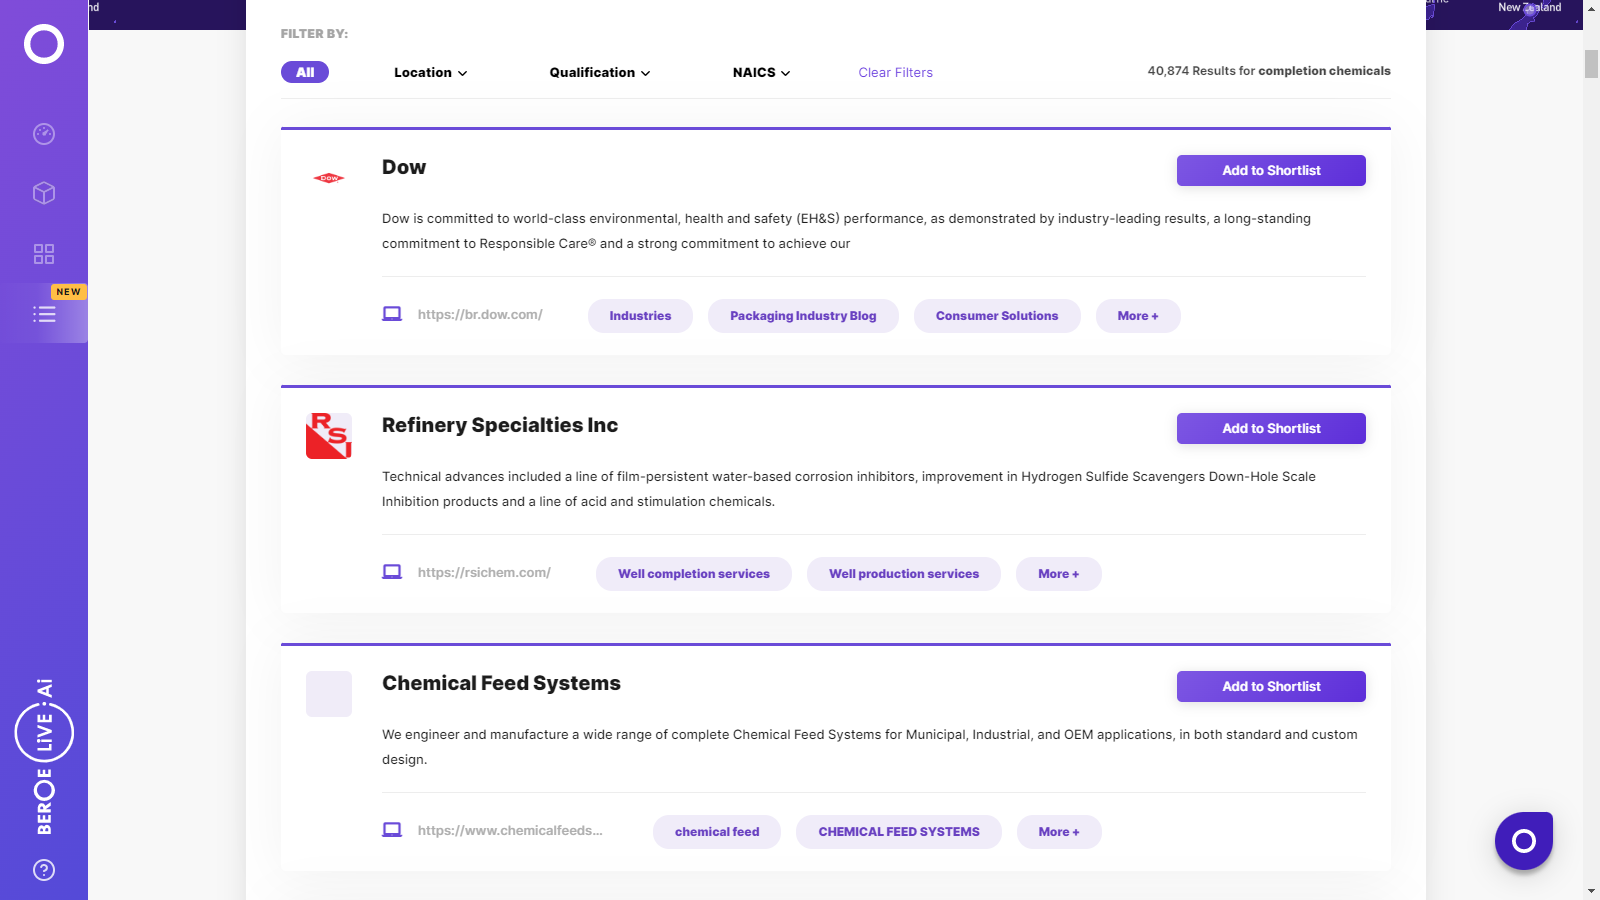
Find the right-fit completion chemicals supplier for your specific business needs and filter by location, industry, category, revenue, certifications, and more on Beroe LiVE.Ai™.
Schedule a Demo


Use the Completion Chemicals market, supplier and price information for category strategy creation and Quaterly Business Reviews (QRBs)
Schedule a DemoCompletion Chemicals market report transcript
Completion Chemicals Global Market Outlook:
MARKET OVERVIEW
Global market size: About $5.48 billion (2023 E)
Expected to grow at a CAGR of about 7.1 percent to $6.63 billion by 2026
-
The global completion fluids market is estimated to be approx. $5.48 billion in 2023, and it is expected to reach $6.63 billion by the end of 2026, with a CAGR of 7.1 percent. The completion activities increased across the globe, as the overall upstream and production activities increased as the production output across major markets increased due to growing demand. Oil demand growth and forecast for 2023 stands at 2.4% with the Chinese market opening up from curbs.
-
North America and the Middle East are high-matured markets, while the APAC and LATAM are medium-matured markets
Global Market Overview for Completion Chemicals
-
The global market for completion chemicals is estimated to be $5.48 billion in 2023, at a CAGR of 7.1 percent from 2022 to 2026. The production output for 2023 is set to increase by 2.4%, with many new field exploration & development projects on the pipeline.
-
In terms of value, the global oil & gas completion chemicals set to reach $6.63 billion by the end of 2026, with a CAGR of 7.1 percent. The completion market is completely dependent on the well-completion activities. Driven by high oil prices, reducing oil inventory stockpiles and western ban on Russian supply with EU phasing out Russian imports by February 2023, global oil production set for consistent growth by 2.4% in 2023, and upstream activities across the globe has increased by 16.4 percent by the end of January 2023.
-
New oil & gas field exploration and development projects are on the pipeline for the next few years. Europe set to tackle Russian deficit by investing in new projects in North Sea to boost output and Norway set to lead the region in new development and output. Africa has emerged as major supply destination for oil and gas for Europe and set to become a key market in the upcoming years with many new investments being committed across various countries. Despite current OPEC+ production cuts, major players are set to ramp up their output by a significant margin and are investing heavily into new exploration and expansion projects.
Procurement-Centric Five Forces Analysis: Completion Chemicals
Supplier Power
-
Completion fluids are mandatory requirement during completion operation. Due to the war-led chemicals price hike, suppliers have moderate to high power currently. The war has shifted the momentum in the market with major supply chain disruptions leading to high input costs for suppliers
-
Key chemicals registered severe hike in prices, amid supply disruption due to war. These costs are transferred to customers as high prices of drilling chemicals
Barriers to New Entrants
-
Completion fluids are commodity based and can be easily manufactured with right technology. Capex requirement for completion fluids manufacturing is low. However, suppliers require oil & gas expertise for entering into the business
-
The market is highly competitive with many players acquiring a steady contract would be a challenge for new entrants
-
The barriers to new entrants are low to medium
Intensity of Rivalry
-
The market is fragmented with many global and regional suppliers
-
Technology is available to many suppliers. The supplier market is mostly driven by wider service capability, economy of scale, and cost effectiveness of the services
-
Low switching cost. Easy to switch among suppliers with little product differentiation. The intensity of rivalry is high
Threat of Substitutes
- There is no substitute available for completion fluids
Buyer Power
-
The war has impacted the buyer power to negotiate, as key chemicals registered heavy surges leading to hike in key chemicals prices
-
Buyer power currently is medium, as most buyers are invariably exposed to price hikes, as suppliers are transferring their soaring input costs to the customers. Logistics constraints and cost increase are another added factor price hike, which the buyer has limited control
Interesting Reads:
Discover the world of market intelligence and how it can elevate your business strategies.
Learn more about how market intelligence can enable informed decision-making, help identify growth opportunities, manage risks, and shape your business's strategic direction.
Get Ahead with AI-Enabled Market Insights Schedule a Demo Now
