CATEGORY
Social Media Marketing
Beroe LiVE.Ai™
AI-powered self-service platform for all your sourcing decision needs across 1,200+ categories like Social Media Marketing.
Market Data, Sourcing & Supplier Intelligence, and Price & Cost Benchmarking.
Schedule a DemoSocial Media Marketing Market Monitoring Dashboard
Understand the correlation between costs, margins, and prices impacting your category on a real time basis on Beroe LiVE.Ai™
Schedule a DemoSocial Media Marketing Industry Benchmarks
Savings Achieved
(in %)
The average annual savings achieved in Social Media Marketing category is 7.40%
Payment Terms
(in days)
The industry average payment terms in Social Media Marketing category for the current quarter is 60.0 days
Compare your category performance against peers and industry benchmarks across 20+ parameters on Beroe LiVE.Ai™
Category Strategy and Flexibility
Engagement Model
Supply Assurance
Sourcing Process
Supplier Type
Pricing Model
Contract Length
SLAs/KPIs
Lead Time
Supplier Diversity
Targeted Savings
Risk Mitigation
Financial Risk
Sanctions
AMEs
Geopolitical Risk
Cost Optimization
Price per Unit Competitiveness
Specification Leanness
Minimum Order Quality
Payment Terms
Inventory Control
The World’s first Digital Market Analyst
Abi, the AI-powered digital assistant brings together data, insights, and intelligence for faster answers to sourcing questions
Abi is now supercharged with GPT4 AI engine. Enjoy the ease of ChatGPT, now on Abi
Social Media Marketing Suppliers

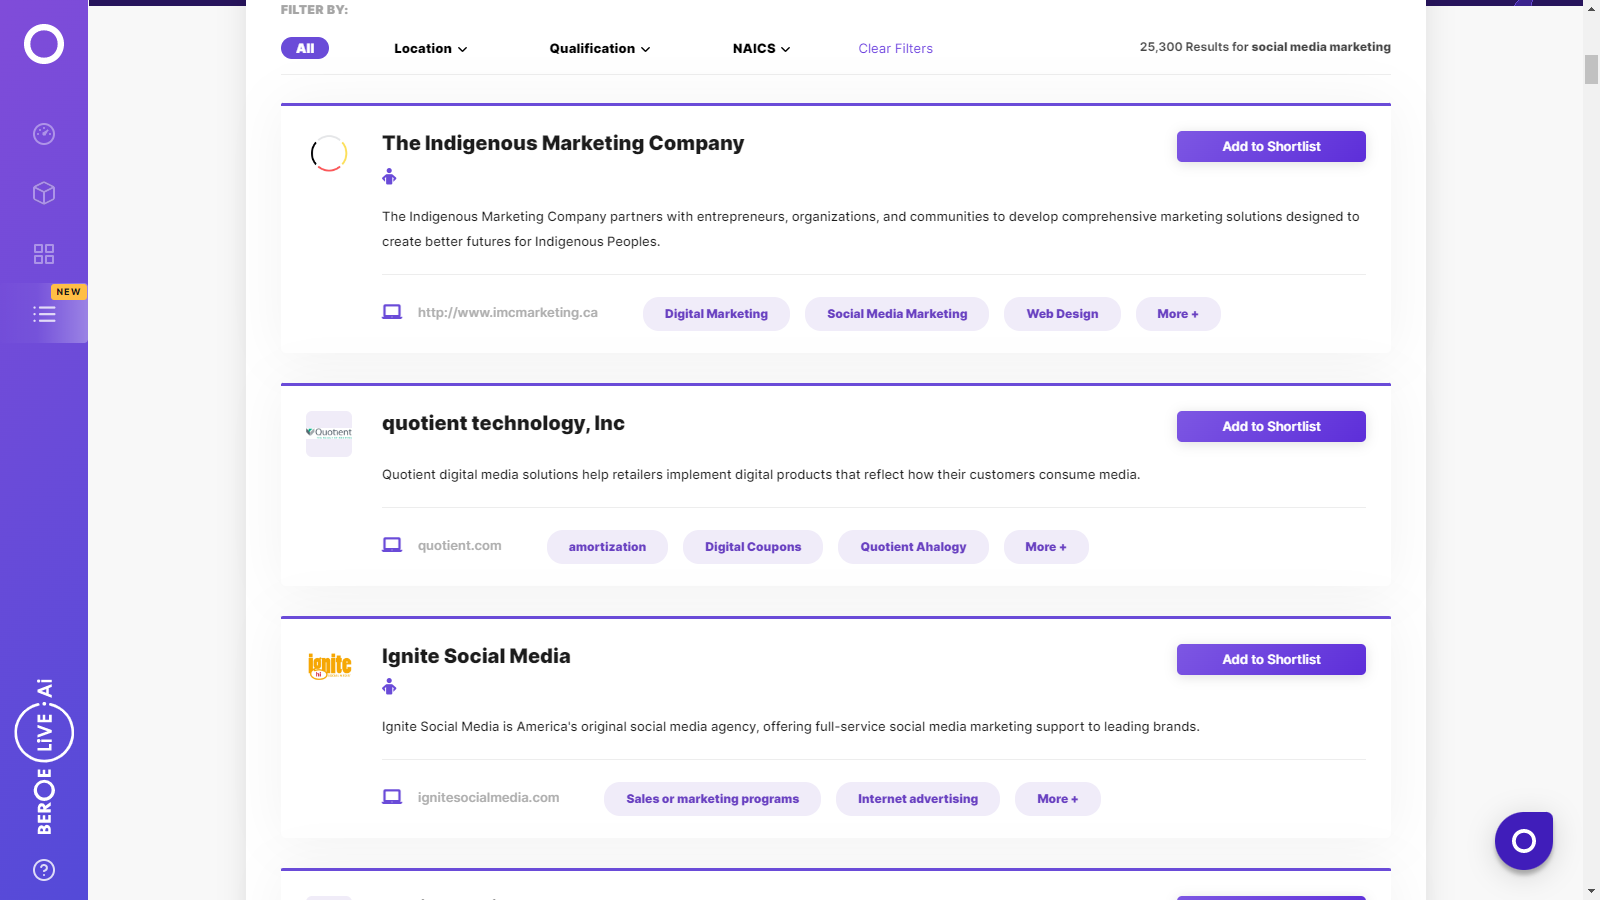
Find the right-fit social media marketing supplier for your specific business needs and filter by location, industry, category, revenue, certifications, and more on Beroe LiVE.Ai™.
Schedule a Demo

Social Media Marketing Market Intelligence
global market outlook
- The Social Media Marketing Services market is estimated to grow to $140–$150 billion (2022)E at CGPR of 10 - 12 percent, followed by North America $42–44 billion, growing at 11–12 percent. Further, the Digital Marketing services market size in APAC is $20–$22 billion, growing at 13–15 percent.
- The FMCG sector continues to spend highly on social media channels and leveraging the impact of social media influencers on user buying decisions.
- The social media ad spending is expected to increase in the European region. The ad spending in the UK grew by around 20 – 23% in 2022.
- The APAC market is experiencing a budget shift to social media, due to high active users in China and India. Increasing price trend is observed in Chinese and Japanese markets

Use the Social Media Marketing market, supplier and price information for category strategy creation and Quaterly Business Reviews (QRBs)
Schedule a DemoSocial Media Marketing market frequently asked questions
The global social media market was valued at $84-86 Bn in 2019. It touched the $102 Bn mark in 2020, growing at an 18.8% CAGR.
Key market drivers include accelerating usage of social media platforms to reach a wider audience and increasing inclination toward influencer marketing for high engagement and conversion rates. Moreover, social media platforms help brands boost their market presence and gain a competitive edge by assessing the competition and consumer patterns.
As per Beroe’s category intelligence report, the average industry ad expenditure on social media has surged by 38% in Q3, with a notable rise in FMCG (61%), automotive (59%), finance (35%), and e-commerce (27%).
For social media marketers, calculating the value of a post/tweet shared compared to clicks on an ad is challenging. Further, the lack of standard measures for social media platforms and rising data privacy concerns are compelling market players to reinvent their business strategies.
The COVID-19 pandemic has augured well for the social media market, given the tremendous growth in usage and data generation, especially after the nationwide lockdowns. After the initial pause, many brands have scaled their social media ads expenditure as well. Instagram and Facebook have been the most active platforms across the globe.
Asia Pacific (APAC) continues to offer lucrative growth opportunities for the players in the social media market, given the largest number of social media users, mostly YouTube and Twitter. Furthermore, increasing internet penetration, rising tech-savvy population, and improving connectivity have triggered the region’s usage of social media platforms.
Social Media Marketing market report transcript
Global Market Outlook on Social Media Marketing
-
The global social media ad spend in 2023 is estimated to around $ 225 billion and the total social media users accounted for around 4.2 billion users in 2023
-
Tik Tok, YouTube, WhatsApp, and Instagram continue to be the most used social media platforms globally, with Instagram having a major share in social media marketing, however, TikToK has experienced a rapid growth in the past year
Global Social Media Marketing Maturity
-
The market maturity is high in North America, closely followed by Western Europe. Fashion, apparel, and media are the high-spending categories in APAC and North America across all social media platforms. Shoppable ads and sponsored ads are highly adopted by marketers across social media platforms.
Global Social Media Marketing Market Drivers and Constraints
The growth of online video content and ease of incorporating social media platforms for brand engagement and target audience reach are driving factors for marketers to adopt social media advertising. Platforms, like Facebook and Instagram, generates high ROI and features, like sponsored posts, Live videos, Stories, posts drive traffic and increase sales.
Drivers
Increase in Usage of Social Media Management Tools
-
Advertisers are increasingly using technology-based platforms to plan and buy, to have better reach and receive higher impressions. Social media listening tools are used to streamline and consolidate marketing campaigns, which, in turn, increases brand engagement.
Influencer Marketing
-
Influencer marketing is the new age advertising with high engagement and conversion rates among marketers. It is prevalent on social platforms, such as Instagram and Facebook, where it allows marketers to deliver brand messages in a wide range of formats –tweets, post, video, story to reach target audience in a broader level.
Constraints
Measuring Social Media ROI
-
Measuring social media ROI is different from traditional marketing. It is challenging for marketers to calculate the value of a tweet/post shared compared to click on an ad. Implementing a specific business goal and social media strategy in place helps in measuring the ROI efficiently.
Cost Structure: Social Media Marketing
-
Labor/staff cost contributes to a maximum of 45–50 percent of the overall agency base price, and comprises of direct cost (direct payroll cost) and indirect cost (third-party engagement cost). Staff cost differs widely, depending on the scope of the project (e.g., an average content writer earns 30–40 percent higher than a general web content writer in the US).
Social Media Marketing Demand Market Outlook
The average industry ad spend on social media increased by 38 percent in Q4, with a significant increase in categories, such as FMCG (61 percent), auto (59 percent), finance (35 percent), and e-commerce (27 percent).
Demand Trends
North America
-
The FMCG sector continues to spend highly on social media channels and leveraging the impact of social media influencers on user buying decisions
-
FMCG companies realize high ROI by engaging with influencers than traditional advertising post the pandemic
Europe
-
The social media ad spending is expected to increase in the European region. The ad spending in the UK grew by around 25–31 percent in 2023
-
Brands are using influencers and social media platforms, like Facebook, Instagram, and YouTube, promote their products through focused campaigns
Asia
-
APAC will continue to be the fastest growing region, in terms of social media usage in 2023. Facebook and YouTube are the dominant social media channel used in APAC by consumers, however, western platforms are banned in China
-
Localized targeting by FMCG brands are majorly done via social media platforms, like Instagram and Youtube
Interesting Reads:
Discover the world of market intelligence and how it can elevate your business strategies.
Learn more about how market intelligence can enable informed decision-making, help identify growth opportunities, manage risks, and shape your business's strategic direction.
Get Ahead with AI-Enabled Market Insights Schedule a Demo Now
