CATEGORY
Airport Advertising
Beroe LiVE.Ai™
AI-powered self-service platform for all your sourcing decision needs across 1,200+ categories like Airport Advertising.
Market Data, Sourcing & Supplier Intelligence, and Price & Cost Benchmarking.
Schedule a DemoAirport Advertising Industry Benchmarks
Savings Achieved
(in %)
The average annual savings achieved in Airport Advertising category is 7.90%
Payment Terms
(in days)
The industry average payment terms in Airport Advertising category for the current quarter is 58.0 days
Compare your category performance against peers and industry benchmarks across 20+ parameters on Beroe LiVE.Ai™
Category Strategy and Flexibility
Engagement Model
Supply Assurance
Sourcing Process
Supplier Type
Pricing Model
Contract Length
SLAs/KPIs
Lead Time
Supplier Diversity
Targeted Savings
Risk Mitigation
Financial Risk
Sanctions
AMEs
Geopolitical Risk
Cost Optimization
Price per Unit Competitiveness
Specification Leanness
Minimum Order Quality
Payment Terms
Inventory Control
The World’s first Digital Market Analyst
Abi, the AI-powered digital assistant brings together data, insights, and intelligence for faster answers to sourcing questions
Abi is now supercharged with GPT4 AI engine. Enjoy the ease of ChatGPT, now on Abi
Airport Advertising Suppliers
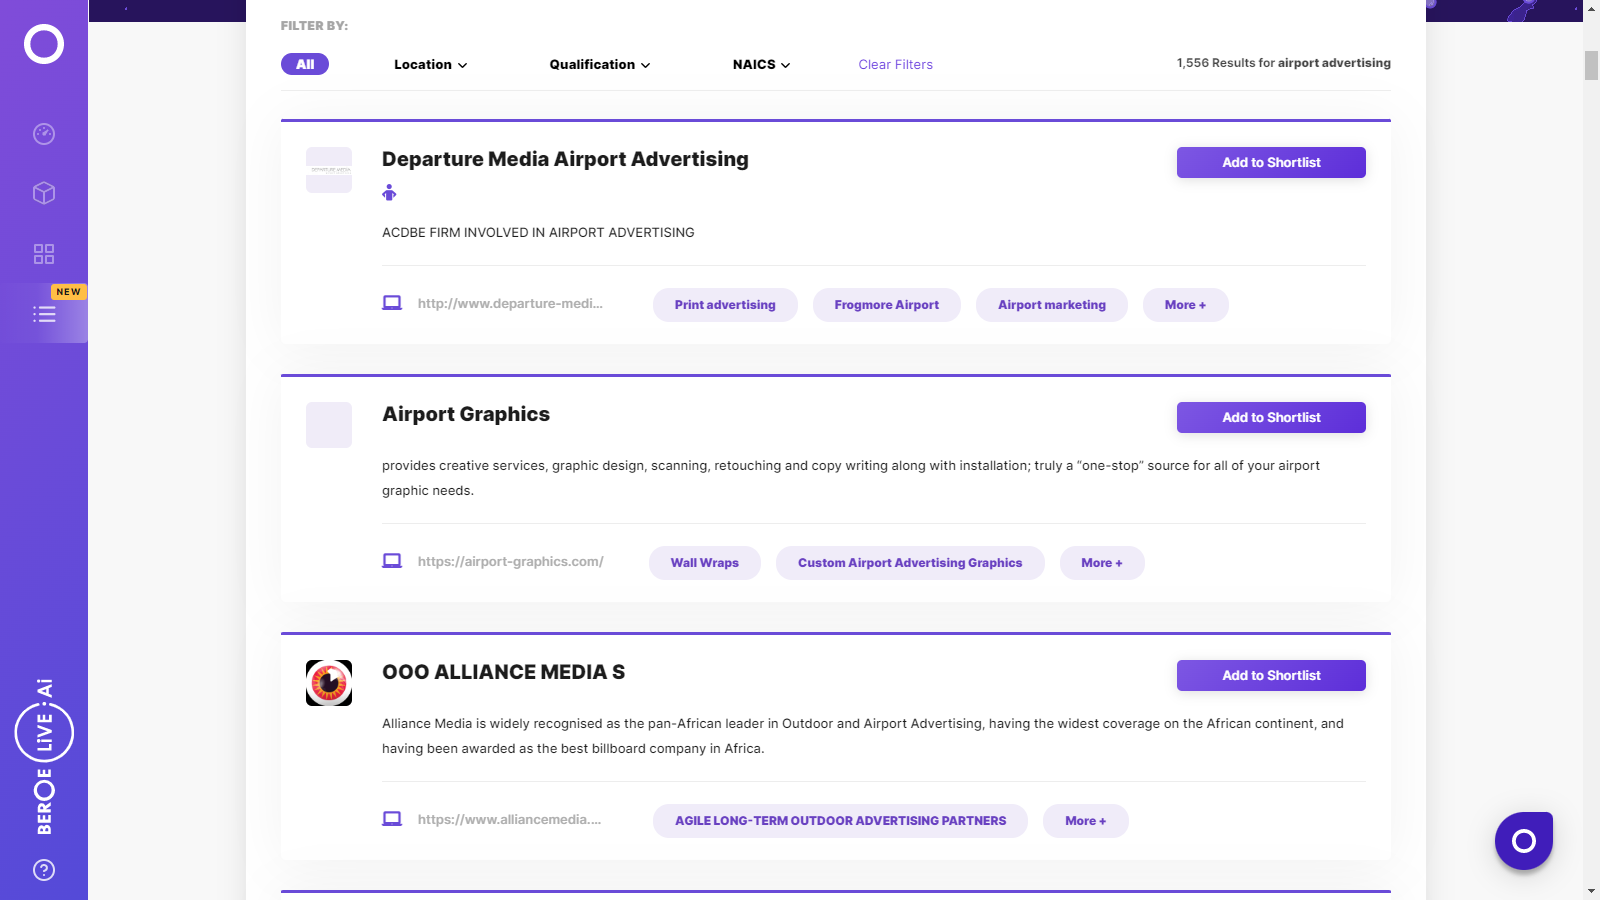
Find the right-fit airport advertising supplier for your specific business needs and filter by location, industry, category, revenue, certifications, and more on Beroe LiVE.Ai™.
Schedule a Demo

Use the Airport Advertising market, supplier and price information for category strategy creation and Quaterly Business Reviews (QRBs)
Schedule a DemoAirport Advertising market report transcript
Airport Advertising Global Market Outlook
-
The global market size of airport advertising is predicted to reach $4–5 billion with a growth rate of 10.6 percent in 2021
-
The growth of digital billboards and increasing spend on programmatic advertising are the major factors for growth of the industry
Impact of COVID-19 on Airport Advertising Industry
-
The pandemic caused marketers to withdraw their demand for advertising, thereby leading to a decline in prices in the market. However, 2021 is offering a period of revival, wherein travel and airports are operational, making it conducive to opt for airport advertising.
-
The stocks for many outdoor advertising companies fell significantly by a huge margin
-
The decline in ad spend for airport advertising crossed 13 percent approximately in 2020
-
In Q1 2020, there was close to 620 million passenger reduction caused by airport closures and travel restrictions, as imposed by governments across the globe
-
Existing advertisers began to shift to digital methods of advertising, which added to a decrease in demand for airport advertising during the pandemic
Global Airport Advertising Market: Drivers and Constraints
The global market is estimated to witness growth in revenue, the major driving force being the traffic of passengers, due to resumed operations in the travel sector and brand communication.
Industry Drivers
-
Digital ad spend: Considering the changing consumer behavior, due to the COVID-19 outbreak, usage of digital platform has gained more importance. Programmatic OOH technologies and interactive billboards will contribute toward optimizing the campaigns and driving the market growth.
-
Resuming operations: With the opening of airports and eased travel restrictions will eventually enable passenger traffic, thereby increasing revenue opportunity for the industry.
Constraints
-
Pandemic restrictions: The industry faced a steep downfall in revenue, due to the rules and restrictions imposed, on the account of the pandemic. The impact on the economy has created a hesitance among buyers with respect to their ad budgets.
-
Increased Cost: The costs of renting ad spaces at premium airports and locations are high
Interesting Reads:
Discover the world of market intelligence and how it can elevate your business strategies.
Learn more about how market intelligence can enable informed decision-making, help identify growth opportunities, manage risks, and shape your business's strategic direction.
Get Ahead with AI-Enabled Market Insights Schedule a Demo Now