CATEGORY
Advertisement Production
Beroe LiVE.Ai™
AI-powered self-service platform for all your sourcing decision needs across 1,200+ categories like Advertisement Production.
Market Data, Sourcing & Supplier Intelligence, and Price & Cost Benchmarking.
Schedule a DemoAdvertisement Production Industry Benchmarks
Savings Achieved
(in %)
The average annual savings achieved in Advertisement Production category is 5.30%
Payment Terms
(in days)
The industry average payment terms in Advertisement Production category for the current quarter is 51.0 days
Compare your category performance against peers and industry benchmarks across 20+ parameters on Beroe LiVE.Ai™
Category Strategy and Flexibility
Engagement Model
Supply Assurance
Sourcing Process
Supplier Type
Pricing Model
Contract Length
SLAs/KPIs
Lead Time
Supplier Diversity
Targeted Savings
Risk Mitigation
Financial Risk
Sanctions
AMEs
Geopolitical Risk
Cost Optimization
Price per Unit Competitiveness
Specification Leanness
Minimum Order Quality
Payment Terms
Inventory Control
The World’s first Digital Market Analyst
Abi, the AI-powered digital assistant brings together data, insights, and intelligence for faster answers to sourcing questions
Abi is now supercharged with GPT4 AI engine. Enjoy the ease of ChatGPT, now on Abi
Advertisement Production Suppliers

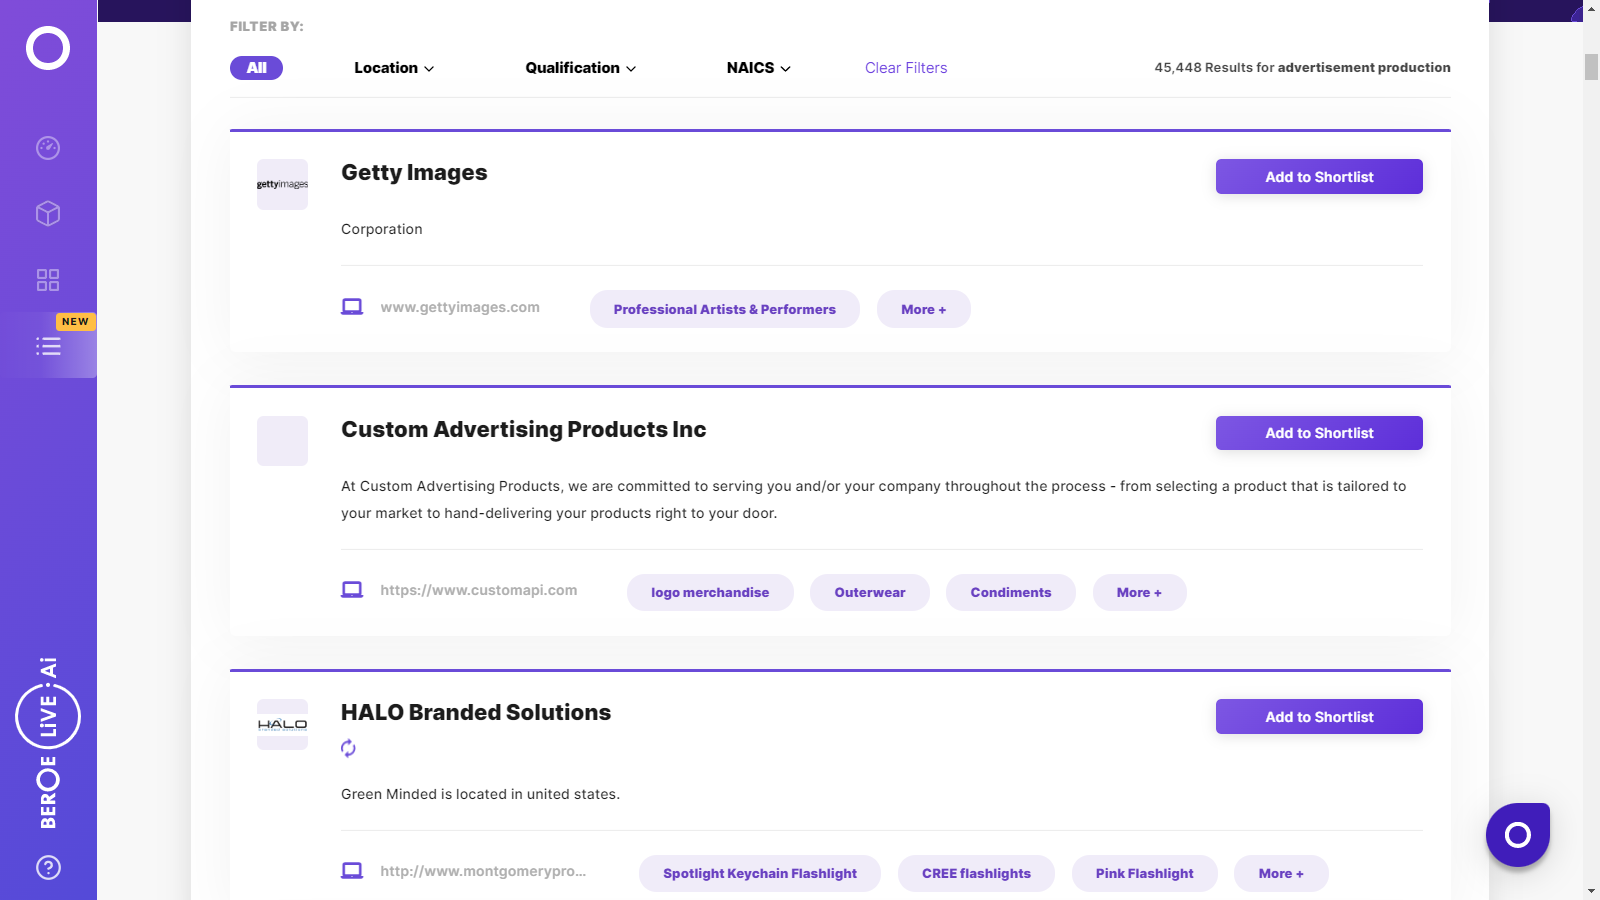
Find the right-fit advertisement production supplier for your specific business needs and filter by location, industry, category, revenue, certifications, and more on Beroe LiVE.Ai™.
Schedule a Demo

Advertisement Production Market Intelligence
global market outlook
- The production market is expected to grow at a rate of 15-17 percent and reach 70 – 75 USD billion 2022
- Markets such as North America, Europe - UK, Germany, France, Italy, Spain and markets in APAC, such as Japan, Hong Kong, Singapore, South Korea have high market maturity.
- Leading production suppliers include, Biscuit Filmworks, Smuggler, Somesuch, Stink Films, Pulse Films, etc.

Use the Advertisement Production market, supplier and price information for category strategy creation and Quaterly Business Reviews (QRBs)
Schedule a DemoAdvertisement Production market report transcript
Advertisement Production Global Market Outlook:
-
The global ad spend is expected to grow at a rate of 3–5 percent YOY reaching $730 - 750 billion in 2023 as per expert predictions
-
Advertisement production spend will be approximately valued at $70–75 billion in 2023
-
Experts predict the rise of digital, virtual production and convergence of media, creative and production services with the preferred suppliers are likely to continue
Advertisement Production Demand Market Outlook
-
Easing of lockdowns and acceptance of the ‘new normal’ production companies resumed work. Revenue numbers will be steered by inflation price increase as well as few events such as Rugby World Cup 2023 and FIFA women’s world cup 2023
Advertisement Production Global Drivers and Constraints
The global production market did well particularly in the later half of 2021. The demand and supply in the industry will be largely fuelled by the cyclical events in 2022.
Drivers
-
Increasing in-house agencies: Bringing the production activities in-house has become popular among the buyers in the industry, especially in the event of the pandemic, wherein operations and engagements with agencies are disrupted. This has also helped them to attain quicker turnaround time and achieve efficiency.
-
Demand for multiple platforms: Increase in digital and other platforms, such as mobile, coupled with faster wireless services, has increased the need for cross-media production services across industries.
-
Cyclical events: The occurrence of cyclical events in 2022 is likely to further steer the growth.
-
Increasing penetration into newer markets: Marketers are increasing their focus on newer markets in APAC and Africa, which have higher growth expectations.
Constraints
-
Lack of transparency in production costs: Marketers face challenges, in terms of lack of transparency in the costs involved for the production activities in a particular project. In many instances, they tend to bear additional costs, due to scope creep, prolonged days of shooting or involvement of senior personnel for more than the accounted hours.
-
Pandemic restrictions: resurgence of the new variant of COVID-19 has brought about restrictions around travel, strict safety protocols and on—site shoots. However, with past experiences the industry has learnt to approach the challenges and work around the hurdles.
Interesting Reads:
Discover the world of market intelligence and how it can elevate your business strategies.
Learn more about how market intelligence can enable informed decision-making, help identify growth opportunities, manage risks, and shape your business's strategic direction.
Get Ahead with AI-Enabled Market Insights Schedule a Demo Now
