CATEGORY
Out Of Home Media
Beroe LiVE.Ai™
AI-powered self-service platform for all your sourcing decision needs across 1,200+ categories like Out Of Home Media.
Market Data, Sourcing & Supplier Intelligence, and Price & Cost Benchmarking.
Schedule a DemoOut Of Home Media Industry Benchmarks
Savings Achieved
(in %)
The average annual savings achieved in Out Of Home Media category is 7.90%
Payment Terms
(in days)
The industry average payment terms in Out Of Home Media category for the current quarter is 58.0 days
Compare your category performance against peers and industry benchmarks across 20+ parameters on Beroe LiVE.Ai™
Category Strategy and Flexibility
Engagement Model
Supply Assurance
Sourcing Process
Supplier Type
Pricing Model
Contract Length
SLAs/KPIs
Lead Time
Supplier Diversity
Targeted Savings
Risk Mitigation
Financial Risk
Sanctions
AMEs
Geopolitical Risk
Cost Optimization
Price per Unit Competitiveness
Specification Leanness
Minimum Order Quality
Payment Terms
Inventory Control
The World’s first Digital Market Analyst
Abi, the AI-powered digital assistant brings together data, insights, and intelligence for faster answers to sourcing questions
Abi is now supercharged with GPT4 AI engine. Enjoy the ease of ChatGPT, now on Abi
Out Of Home Media Suppliers
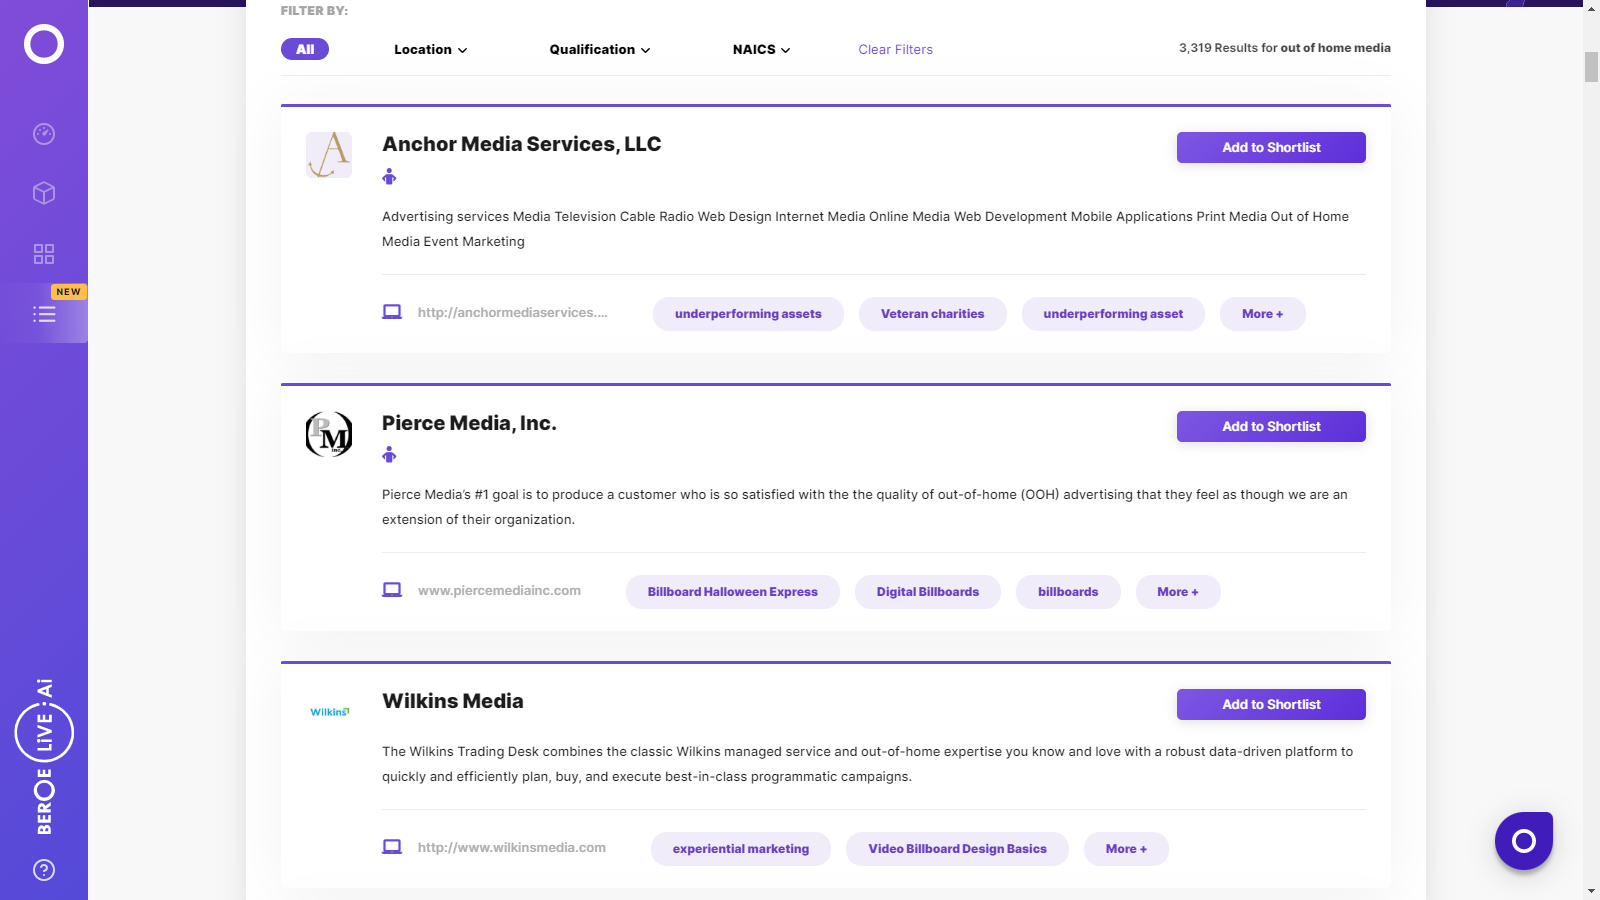
Find the right-fit out of home media supplier for your specific business needs and filter by location, industry, category, revenue, certifications, and more on Beroe LiVE.Ai™.
Schedule a Demo

Out Of Home Media Market Intelligence
global market outlook
- The global market size of Out Of Home Advertising is predicted to reach USD 40.1 billion with a growth rate of 11.5% in 2022.
- Increasing spending on programmatic advertising and the development of digital billboards are the main drivers for the industry's growth.
- Markets such as North America, Europe - UK, Germany, France, Italy, Spain and markets in APAC, such as Japan, Hong Kong, Singapore, South Korea have high market maturity.
- Top global suppliers are JC Deaux, Clear Channel Outdoor, Lamar Advertising, Outfront Media
Use the Out Of Home Media market, supplier and price information for category strategy creation and Quaterly Business Reviews (QRBs)
Schedule a DemoOut Of Home Media market report transcript
Out Of Home Media Global Market Outlook
-
The global market size of OOH advertising is predicted to reach $30.18 billion with a growth rate of 6.7 percent in 2021
-
The growth of digital billboards and increasing spend on programmatic advertising are the major factors for the growth of the industry
Impact of COVID-19 on Out Of Home Media Industry
-
There is a recovery in demand in OOH media, and therefore, a slight hike in prices. Brand owners are looking for maximizing the OOH media and are looking for the most optimized OOH media buying solutions.
-
Existing advertisers began to shift to other mediums of advertising, due to lockdowns during the pandemic, which added to a decrease in demand for OOH advertising
Global Out Of Home Media Market: Drivers and Constraints
The global market is estimated to witness an overall growth of 19–23 percent, with digital OOH constituting to more than 55 percent of the OOH media spend. The cyclical events are expected to drive the revenue numbers for OOH media in 2022.
Industry Drivers
-
Digital ad spend: Considering the changing consumer behavior, due to the COVID-19 outbreak, the usage of digital platforms has gained more importance. Programmatic OOH technologies and interactive billboards will contribute toward optimizing the campaigns and driving the market growth.
-
Sporting cyclical events: Sporting events, such as FIFA World Cup, Winter Olympics, US midterm elections, are expected to increase the OOH ad spending across the Asian and North American regions.
Constraints
-
Pandemic restrictions: The industry faced a steep downfall in revenue, due to the rules and restrictions imposed on the account of the pandemic. The impact on the economy has created a hesitance among buyers with respect to their ad budgets.
-
Some buyers are of opinion that outdoor ads are outdated and believe that mobile and digital advertising is paving the way to the advertising world.
-
Increased cost: The costs of renting digital billboards at bigger cities are high.
Interesting Reads:
Discover the world of market intelligence and how it can elevate your business strategies.
Learn more about how market intelligence can enable informed decision-making, help identify growth opportunities, manage risks, and shape your business's strategic direction.
Get Ahead with AI-Enabled Market Insights Schedule a Demo Now