CATEGORY
Mannequins
Beroe LiVE.Ai™
AI-powered self-service platform for all your sourcing decision needs across 1,200+ categories like Mannequins.
Market Data, Sourcing & Supplier Intelligence, and Price & Cost Benchmarking.
Schedule a DemoMannequins Market Monitoring Dashboard
Understand the correlation between costs, margins, and prices impacting your category on a real time basis on Beroe LiVE.Ai™
Schedule a DemoMannequins Industry Benchmarks
Savings Achieved
(in %)
The average annual savings achieved in Mannequins category is 7.40%
Payment Terms
(in days)
The industry average payment terms in Mannequins category for the current quarter is 58.6 days
Compare your category performance against peers and industry benchmarks across 20+ parameters on Beroe LiVE.Ai™
Category Strategy and Flexibility
Engagement Model
Supply Assurance
Sourcing Process
Supplier Type
Pricing Model
Contract Length
SLAs/KPIs
Lead Time
Supplier Diversity
Targeted Savings
Risk Mitigation
Financial Risk
Sanctions
AMEs
Geopolitical Risk
Cost Optimization
Price per Unit Competitiveness
Specification Leanness
Minimum Order Quality
Payment Terms
Inventory Control
The World’s first Digital Market Analyst
Abi, the AI-powered digital assistant brings together data, insights, and intelligence for faster answers to sourcing questions
Abi is now supercharged with GPT4 AI engine. Enjoy the ease of ChatGPT, now on Abi
Mannequins Suppliers
Find the right-fit mannequins supplier for your specific business needs and filter by location, industry, category, revenue, certifications, and more on Beroe LiVE.Ai™.
Schedule a Demo

Mannequins Market Intelligence
global market outlook
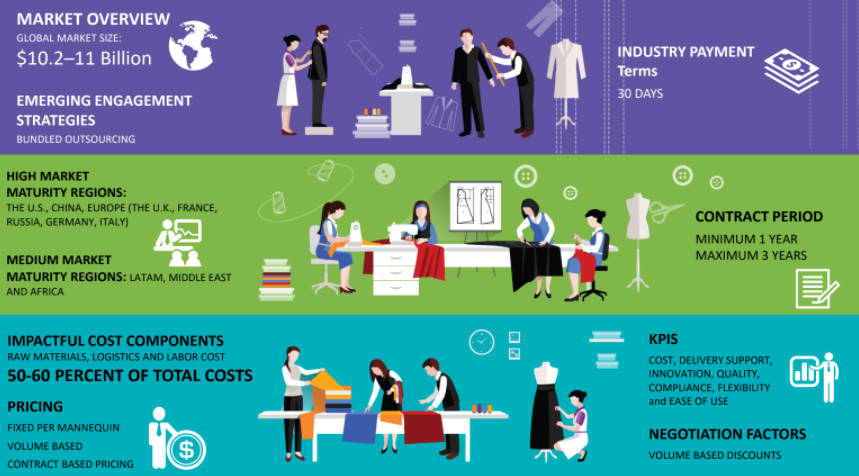
- The global mannequin industry is estimated at $12.5–13.2 Billion in 2022 (E) .North America, Western Europe, and markets in Asia Pacific, such as Chia, and in Europe (the UK, France, Russia, Germany, Italy), have a high market maturity.
- Asia-Pacific, excluding Japan, is anticipated to remain the largest market for mannequins. The mannequin market in Asia-Pacific is projected to register the highest CAGR through 2022, followed by North America. Markets in the Middle East and Africa and Latin America are expected to be high-growth markets.
- North America, Europe and APAC are the key mannequin markets, with high penetration of apparel retail (key end consumers of mannequins), and large number of global and local suppliers supporting these regions.
- Full body mannequins will continue to be the most lucrative among products in the global mannequin market. Sales of full body and upper body mannequins are projected to register the fastest expansion in the market . Adults segment is expected to remain dominant in the global mannequin market.
Use the Mannequins market, supplier and price information for category strategy creation and Quaterly Business Reviews (QRBs)
Schedule a DemoMannequins market report transcript
Mannequin Market Analysis and Global Outlook
-
The global mannequin industry is estimated at $13.86- 14.5 Billion in 2023 (E)
-
North America, Western Europe, and markets in Asia Pacific, such as Chia, and in Europe (the UK, France, Russia, Germany, Italy), have a high market maturity
-
Asia-Pacific, excluding Japan, is anticipated to remain the largest market for mannequins. The mannequin market in Asia-Pacific registered the highest CAGR through 2022, followed by North America
-
Markets in the Middle East and Africa and Latin America are expected to be high-growth markets
Global Mannequin Market Maturity
-
North America, Europe and APAC are the key mannequin markets, with high penetration of apparel retail (key end consumers of mannequins), and large number of global and local suppliers supporting these regions
-
Full body mannequins will continue to be the most lucrative among products in the global mannequin market. Sales of full body and upper body mannequins are projected to register the fastest expansion in the market
-
Adults segment is expected to remain dominant in the global mannequin market
-
Infants & toddlers' segment is expected to be the least lucrative target-group segment in the global mannequin market. Sales of infants and toddlers will witness a steady expansion in the market over the forecast period
Global Mannequin Industry Trends
-
Suppliers are increasing their geographic footprint as mature buyers move towards supplier consolidation. Many established suppliers in Europe have started operations in other key demand markets like the US
-
Global suppliers are focusing on manufacturing Eco friendly mannequins, due to the increasing demand from apparel retailers in Europe (UK, France, Italy, Germany) and the US
Global Drivers and Constraints : Mannequins
Growing expansion of modern retail in the emerging markets is expected to strongly drive mannequin sales. The growing trend of online shopping has necessitated the retailers to make more attractive windows in which mannequins plays an inevitable role
Drivers
Mannequins leveraging technology advancements
-
Mannequins are no longer utilized only for displaying merchandize but also operate as a key source of information by leveraging technological advancements like facial recognition and beacon technology
-
Retailers use beacon enabled mannequins to enhance the customer experience, as well as to retrieve valuable data regarding shopping behavior
-
Innovative applications have increased the demand for mannequins, in addition to its importance in a store environment
Increasing significance of window displays
-
Higher adoption of online shopping, and pre-shopping online research by customers, have increased the significance of window displays as the most powerful tool to drive walk-ins
-
Mannequins have become the most important component of window display, as compared to any other sign or graphic
-
In addition, mannequins have also become an integral part of a brands’ visual identity and hence retailers are ready to invest on mannequins and not compromise on the premium look and quality
Constraints
Hologram Mannequins
-
Hologram mannequins can interact with customers and also offer coupons that can be scanned and redeemed using a smartphone
-
Hologram mannequins used in combination with physical mannequins can reduce the planned number of mannequins, near the store entrance, which can indirectly impact the demand of mannequins
-
Virtual mannequins are being explored in retail stores, airports, corporate offices, shopping malls, etc., to enhance customer experience and drive sales
Increasing adoption of E- Commerce Retail
-
Increasing online shopping would reduce the significance of other retail formats, posing a threat to the sales of Brick and mortar stores which can affect the demand for mannequins
Innovations
Retailers are increasingly finding new methods to utilize various innovative solutions that engages customers and also provides valuable data on shopping patterns.
Beacon Enabled Mannequins
-
For the brand, Beacons can provide valuable data on customers shopping habits, and can boost customer engagement as well as help to pull further customers in-store
-
For the customer, engaging with Beacons gives them access to special content, in-store mapping, and the chance to take advantage of special offers and discounts
3D Printing
-
3D printing is utilized to replace sculpted representation which is later used to prepare the mould
-
This can help reduce the lead time by a few weeks which is a significant period of time in the manufacturing lead-time
-
3D Printing is expected to lower the price of customization as prototyping cost is significantly reduced
Environmental Friendly Production Methods
-
Mannequin manufacturers are focussing on producing environmental friendly mannequins not only to improve working conditions but also to reduce the impact on environment
-
Automated production techniques are utilized to reduce the time taken for production
Face Recognition
-
Retailers are deploying mannequins with facial recognition technology that can identify age, race, gender and dwell time around a display
-
This technology is also used to identify shoplifting suspects, by cross-referencing with a database for a match with past shoplifters or criminals
Interesting Reads:
Discover the world of market intelligence and how it can elevate your business strategies.
Learn more about how market intelligence can enable informed decision-making, help identify growth opportunities, manage risks, and shape your business's strategic direction.
Get Ahead with AI-Enabled Market Insights Schedule a Demo Now