CATEGORY
In-store Merchandisers
Beroe LiVE.Ai™
AI-powered self-service platform for all your sourcing decision needs across 1,200+ categories like In-store Merchandisers.
Market Data, Sourcing & Supplier Intelligence, and Price & Cost Benchmarking.
Schedule a DemoThe World’s first Digital Market Analyst
Abi, the AI-powered digital assistant brings together data, insights, and intelligence for faster answers to sourcing questions
Abi is now supercharged with GPT4 AI engine. Enjoy the ease of ChatGPT, now on Abi
In-store Merchandisers Suppliers

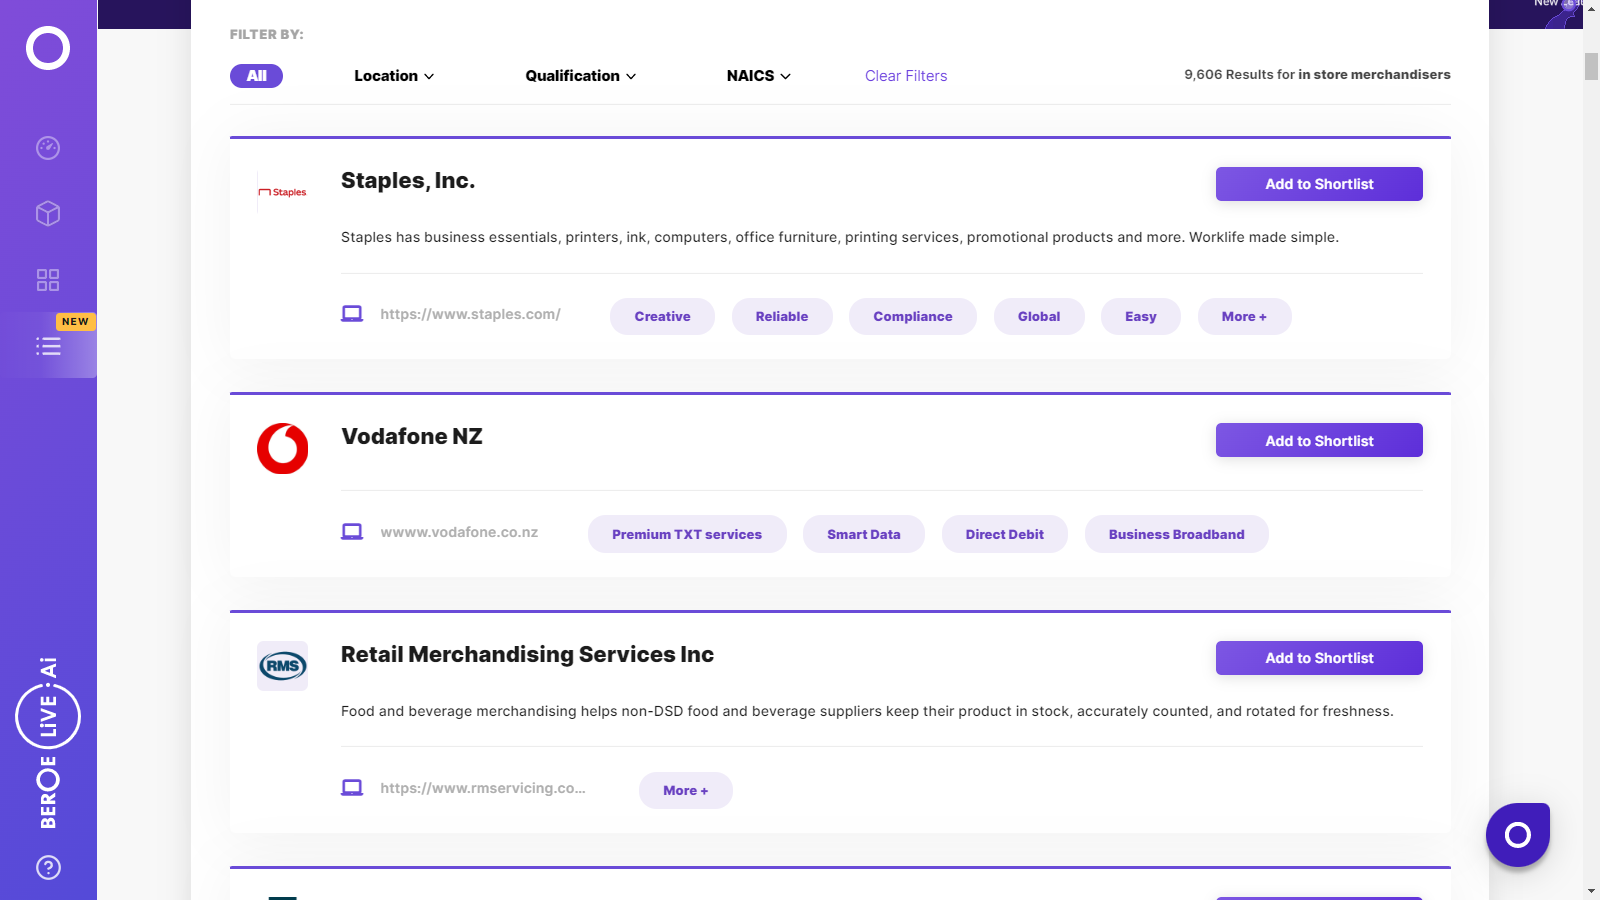
Find the right-fit in-store merchandisers supplier for your specific business needs and filter by location, industry, category, revenue, certifications, and more on Beroe LiVE.Ai™.
Schedule a Demo


Use the In-store Merchandisers market, supplier and price information for category strategy creation and Quaterly Business Reviews (QRBs)
Schedule a DemoIn-store Merchandisers market report transcript
In-store Merchandisers Global Market Outlook
-
The global In-store merchandising market was valued at $5 billion in 2021, and it is growing at approx. 5 percent year-on-year. The growth will be driven by the increase in adoption of modern retail channels in retail market and premium brand’s investment in physical retail
-
Most of the growth in demand will be from the emerging markets in Asia and LATAM, in addition to the United States (US), Oceania and the Middle East
-
Major buyers of the services are Retailers, CPG, Packaged Food, Beverages & Tobacco, Consumer Electronics followed by Pharma Retail
Impact of COVID-19 on In-store Merchandisers Industry
-
Retail market is affected by the pandemic; hence the category had a huge impact in 2020 and 2021. However, retail market is gaining back to normalcy.
-
In-store Merchandising is a dependent category to Retail business and all the macro-economic factors affecting the retail business directly impacts the category
-
Major CPG and Packaged Food brands begin to revisit their procurement strategy on Retail merchandising, as the business is getting back to normal
Global In-store Merchandisers Market: Drivers and Constraints
-
Increase in modern retail stores is a major driver for in-store merchandising category
-
Growth of e-commerce channel is a major constraint
Industry Drivers
-
Increase in the retail market evolution, moving towards modern retail in the growing markets like APAC, LATAM and Eastern Europe
-
Increase in the focus of physical retail by premium retail brands by investing in in-store merchandising
-
Increase in the competitiveness in the retail market, which the brands use visual merchandising as an aid to increase shop sell-outs
-
Expansion of merchandising in major markets like China, India and Southeast Asia
-
Sectors like consumer electronics, pharma retail focusing on retail merchandising like the well-established sectors like CPG and FMCG.
Constraints
-
Increase in the growth of e-commerce and consumers wish to use online platform for shopping is a major constraint to the category
-
In certain markets like India, Africa and in certain countries of LATAM and Southeast Asia, the retail model still doesn’t suit visual merchandising as an effect of the store size
Interesting Reads:
Discover the world of market intelligence and how it can elevate your business strategies.
Learn more about how market intelligence can enable informed decision-making, help identify growth opportunities, manage risks, and shape your business's strategic direction.
Get Ahead with AI-Enabled Market Insights Schedule a Demo Now
