CATEGORY
DTC E-Commerce Industry Europe
E Commerce drives an awareness towards the products that sells electronically (Online). Marketers can use social media, digital content, search engines, email campaigns to gain traction of a particular website
Beroe LiVE.Ai™
AI-powered self-service platform for all your sourcing decision needs across 1,200+ categories like DTC E-Commerce Industry Europe.
Market Data, Sourcing & Supplier Intelligence, and Price & Cost Benchmarking.
Schedule a DemoThe World’s first Digital Market Analyst
Abi, the AI-powered digital assistant brings together data, insights, and intelligence for faster answers to sourcing questions
Abi is now supercharged with GPT4 AI engine. Enjoy the ease of ChatGPT, now on Abi
DTC E-Commerce Industry Europe Suppliers

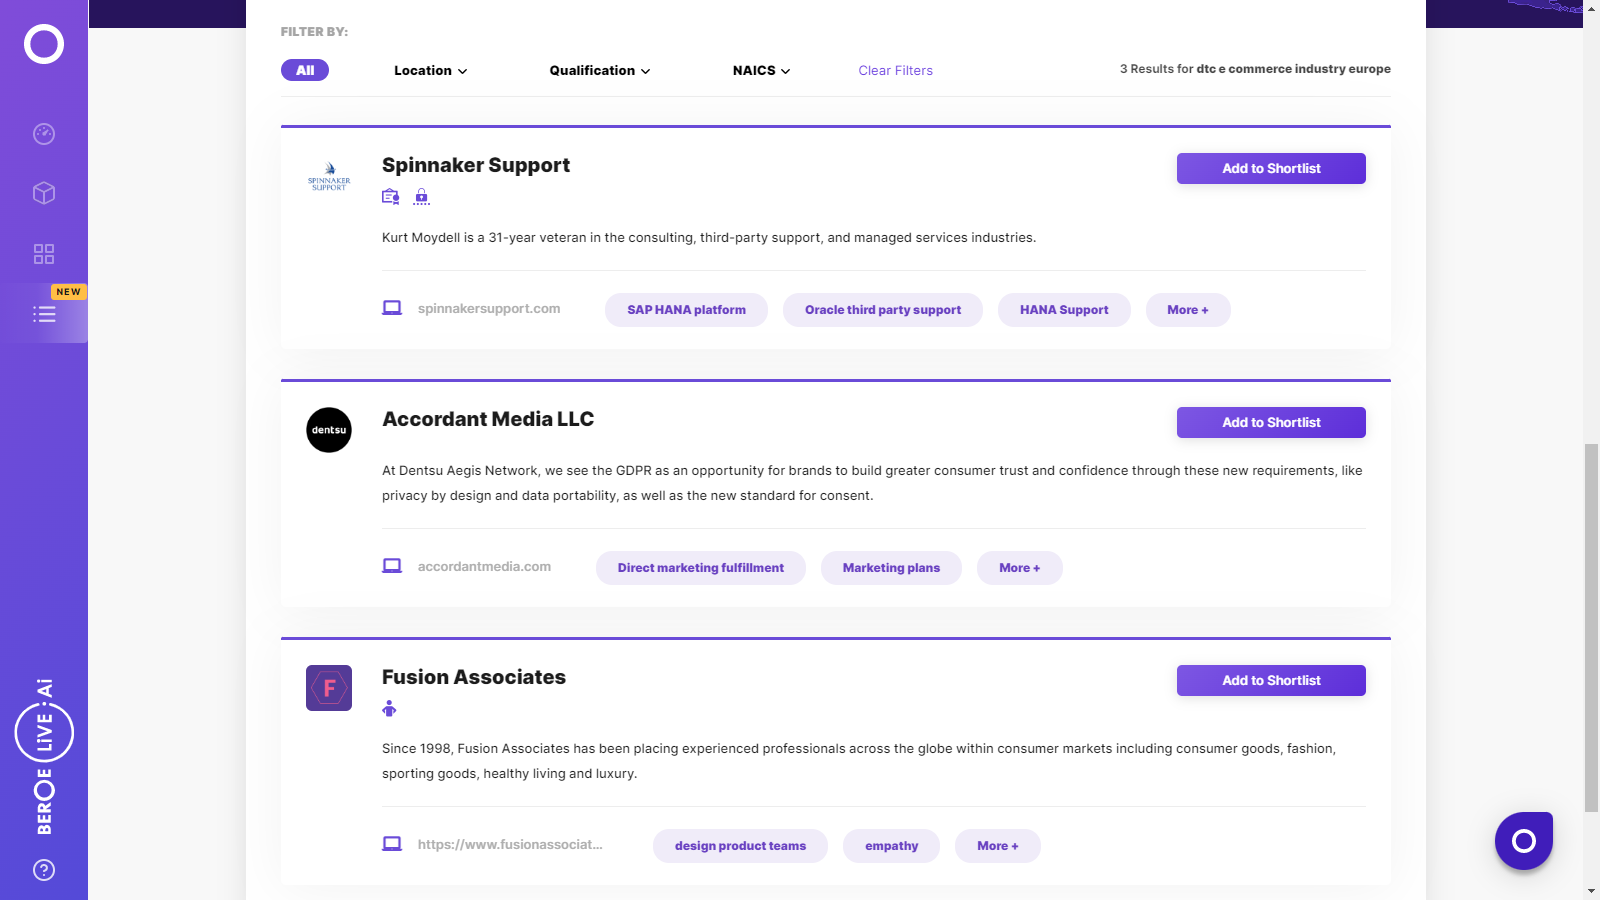
Find the right-fit dtc e-commerce industry europe supplier for your specific business needs and filter by location, industry, category, revenue, certifications, and more on Beroe LiVE.Ai™.
Schedule a Demo


Use the DTC E-Commerce Industry Europe market, supplier and price information for category strategy creation and Quaterly Business Reviews (QRBs)
Schedule a DemoDTC E-Commerce Industry Europe market report transcript
E-Commerce Industry Outlook
Apparel, consumer electronics, and furniture remained the key product categories of sales in e-commerce marketplace. Personal and baby care products account for 6.5 percent and 5.2 percent of sales through e-commerce channels.Europe is the world's third largest region in B2C e-commerce sales.
E-Commerce Market Outlook (2017–2021)
- The US, China, UK, Japan, Germany, France, South Korea, Russia, Belgium, and Australia are the top 10 countries in e-commerce market, with the top three jointly accounting for 77.6 percent of the global e-commerce sales
- Number of digital shoppers is also expected to increase rapidly (by 32 percent to 2,000 million by 2020), projecting a bright future for retailers/CPG manufacturers investing in e-commerce
- Key factors driving growth would be the growing emphasis on omni-channel offerings, seamless integration of online-offline sales channels, competitive online prices, cross border e-commerce, increasing trend of repetitive and high value online transactions
- Key players - Amazon, Tesco, ASDA
E-Commerce Regional Outlook
The European region has the most dynamic e-commerce market impacting the overall retail environment. Throughout Europe, shoppers expect personalized and connected experience across all channels.
European E-Commerce Market Outlook
- The European e-commerce sales increased by 14–15 percent in 2016–2017. The UK and Germany are the largest markets accounting for 40–42 percent sales
- In mature markets, consumer shopping online has become high, 87 percent in the UK, 80 percent in Denmark, and 82 percent in Germany, respectively
- France is one of the leading e-commerce markets, with about 89 percent of its internet users having shopped online. It is also a popular destination for cross-border online shopping
Key Trends E-Commerce: Europe
Social Commerce
- To capitalize on the e-commerce growth, social networking sites rolled out their own versions of buy buttons
- Over $30 billion was generated directly from social commerce in 2015. Facebook is the leader in generating e-commerce sales, but the average per order value in Instagram ($65) & Pinterest ($58.9) is higher than Facebook ($55)
Cross-Border E-Commerce
- The global B2C cross-border e-commerce market is expected to post a robust growth to a size of $1 trillion in 2020
- In Europe and Latin America, customers shop abroad, mainly because of unavailability of required product in the region and lower prices
Omni Channel Retail
- Many top retailers have included ‘click & collect' options, promoting to save shipping costs. Consumers are willing to pay more for same day delivery, which made retailers to grow their network of fulfillment centers and speed up order delivery time.
- The US, the UK, and Australia have the highest global omni-channel retail index of 50, 49, and 48, respectively
Extended Product Information
- Product content has become the differentiating factor for FMCG brands online. Extended product information, like full ingredients list, nutritional values, usage instructions, etc., is gaining attention among consumers
Mobile Shopper Penetration
- Mobile use on e-commerce sites has grown by over 75 percent in 2016 in Europe. M-Commerce is popular in eastern and southern parts of Europe
- The most popular category in Europe is children products, purchased through smartphone
In-Store Shopping
Supermarkets in Europe have started introducing various in-store technologies, in order to enhance the store experience. For example: Tesco's “scan-as-you-shop service” allows shoppers to scan their products, as they add them to their in-store basket.
Order Management Value Chain
Outsourcing order management in direct to consumer model is not cost effective and affects quality standards. Dollar shave club operates in two distribution centers in-house. These distribution centers fulfill orders within 24 hours, which provide quick and efficient service.
Receive Orders
- Orders are placed on web store
- Shopping cart integration
- Manual entry (B2B) Direct integration with a shopping cart or inventory/order management system is generally preferred
Process Order in Warehouse
- Once the order is received, it is synced to backend order management system, which checks for order availability in warehouse. Then, the stocks are allocated for orders.
Print Orders
- Once the order availability is checked, operation crew prints the orders. As orders are printed, they are sorted by ship method.
Pick, Pack & Ship
- Finalized orders are those which need fulfillment effort to be initiated right from stock allocation, picking, packing, shipping, invoicing, generating shipping labels, etc.
Confirmation
- Order shipments are initiated and notification is sent to customer in each step of delivery. Order fulfilment is complete.
Ecommerce Payments Ecosystem
Large merchants can engage with acquiring banks or with processors/fin-tech service providers directly, to enable e-commerce payment acceptance. Relationship with acquiring banks might be more advantageous to merchants, due to pooling options, cost-benefits, and ease of use for end customers.
Merchant Engagement
- As depicted, merchants only need to engage with acquiring banks, who, in turn, will engage with processors and other entities in the payment system
- Acquiring banks enable merchants to accept payments via cards and other alternative payments solutions (e.g., mobile payments)
- They also provide other services, such as payment gateways (virtual equivalent of a POS), transaction authorization, and dynamic currency conversion
- Merchants can also interact with innovative processors, such as Stripe and PayPal directly. Main advantage of this model would be easier setup
- However, major disadvantage will be larger transaction charges and lengthier payment process (off-site transactions) for end-customers
Top Suppliers – Acquirers
Merchant Engagement
- Europe's 40 largest acquirers handled 57.24 billion transactions, valued at $2.524 trillion from 9.4 million active merchant outlets in 2016
- They handled 7.27 billion web-based and mobile transactions valued at $473.77 billion
- The top 10 acquirers include specialized companies, banks, and joint ventures between both
- PayPal and Adyen are good examples of the top payment gateways that interact directly with the merchants
Interesting Reads:
Discover the world of market intelligence and how it can elevate your business strategies.
Learn more about how market intelligence can enable informed decision-making, help identify growth opportunities, manage risks, and shape your business's strategic direction.
Get Ahead with AI-Enabled Market Insights Schedule a Demo Now
