CATEGORY
Warehousing Australia
Beroe LiVE.Ai™
AI-powered self-service platform for all your sourcing decision needs across 1,200+ categories like Warehousing Australia.
Market Data, Sourcing & Supplier Intelligence, and Price & Cost Benchmarking.
Schedule a DemoThe World’s first Digital Market Analyst
Abi, the AI-powered digital assistant brings together data, insights, and intelligence for faster answers to sourcing questions
Abi is now supercharged with GPT4 AI engine. Enjoy the ease of ChatGPT, now on Abi
Warehousing Australia Suppliers
Find the right-fit warehousing australia supplier for your specific business needs and filter by location, industry, category, revenue, certifications, and more on Beroe LiVE.Ai™.
Schedule a Demo

Use the Warehousing Australia market, supplier and price information for category strategy creation and Quaterly Business Reviews (QRBs)
Schedule a DemoWarehousing Australia market report transcript
Regional Market Outlook on Warehouse
Sydney, Melbourne and Brisbane are the major logistics locations in Australia, where Sydney contributes to ~37 percent of the total warehouse space in Australia.Industry has higher opportunity in obtaining quality storage spaces in New South Wales, Victoria and Queensland as these regions have the highest supply and proximity to major seaports and airports
Sydney in New South Wales remains to be the major logistics center and submarket for premium Class A warehouse comprising ~37 percent of the total warehouse stock in Australia
- Demand for Class A warehouse in Australia is dominated by logistic operators, wherein ~1.15 million sq.m of the total stock was leased in 2017
- In 2017, approx. 68,000 sq.m of space was leased by construction and agro industries
Supply Demand Analysis
Industry has low negotiation power, as the market is demand driven and the availability of quality space is limited; specifically in the major logistics hubs of Australia
Major logistics hubs of Australia are experiencing high levels of demand as supply is tightening particularly for quality space, resulting in occupiers moving towards outskirts or developing custom build facilities.
Australia – Supply vs Demand
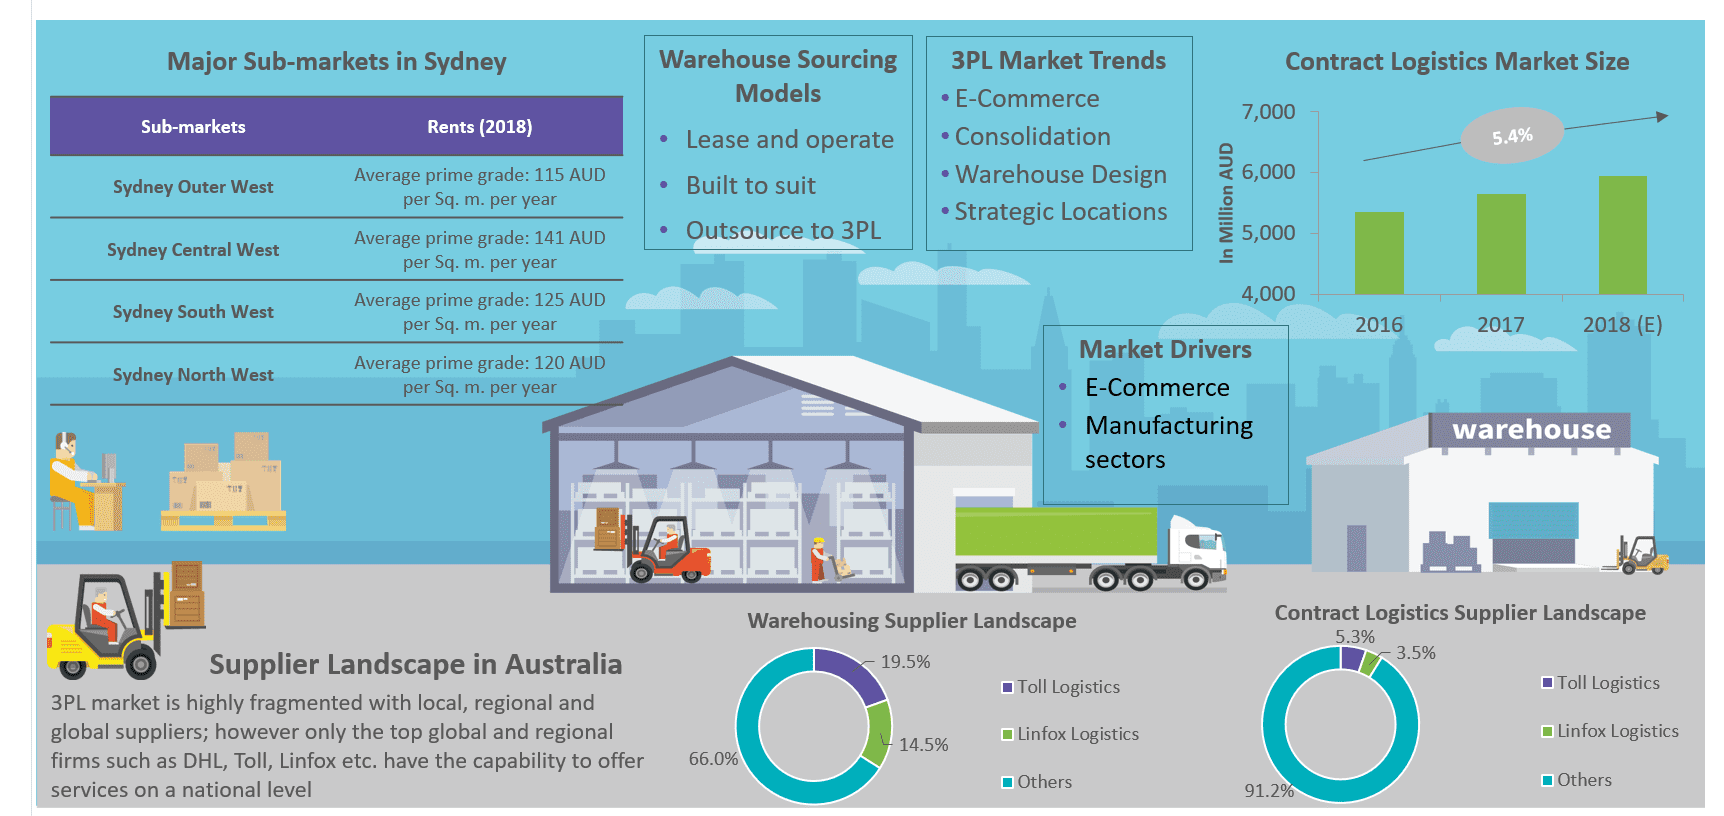
Sydney: Driven by lack of availability of primary-grade supply and high rental rates, major occupiers, such as logistics companies are moving toward the outskirts (i.e., Outer West, South West, and North West submarkets) where rental rates are around 40 percent lower and supply of space is available for custom building facilities. Transport and Logistics dominates the market with ~40 percent of the total demand for warehouse space in 2018
Melbourne: The recent decline in interest rate and improved business confidence levels are expected to sustain warehouse demand from retail and construction buyers. This is expected to match the supply of space, due to speculative development in 2018
Brisbane: Limited availability of prime grade supply and high rental rate are pushing demand toward secondary grade spaces, which accounted to 48 percent of the total demand. In 2018, with the demand for prime and large space existing, owner occupancy is expected to increase further.
Rental Rate Analysis
Industry is expected to have lower rental bargain power in 2018, as the current market characteristics, such as limited availability of space, growing demand for quality assets, and increasing rental rates favor the landlords.
Warehouse rental rates in 2018, is expected to remain stable or record small increase of one-two percent as the demand is inclining towards owners occupier market/adoption of secondary warehouse spaces.
- Sydney: Against a backdrop of limited assets available on the market and diminishing serviced land, the rental rate is expected to increase by almost 1-2 percent in 2018 compared to 2017
- Melbourne: In 2018, prime rental is expected to grow by 1-2 percent , as the demand is growing, and supply is limited, giving landlords better bargaining power compared to the buyers
- Brisbane: Though demand existed rental rate remained flat for the last 12 months and this trend is expected to continue for the entire 2018, as demand is slanting toward owner occupied spaces or secondary grade market
Interesting Reads:
Discover the world of market intelligence and how it can elevate your business strategies.
Learn more about how market intelligence can enable informed decision-making, help identify growth opportunities, manage risks, and shape your business's strategic direction.
Get Ahead with AI-Enabled Market Insights Schedule a Demo Now