CATEGORY
Cross-border E-commerce North America
Beroe LiVE.Ai™
AI-powered self-service platform for all your sourcing decision needs across 1,200+ categories like Cross-border E-commerce North America.
Market Data, Sourcing & Supplier Intelligence, and Price & Cost Benchmarking.
Schedule a DemoThe World’s first Digital Market Analyst
Abi, the AI-powered digital assistant brings together data, insights, and intelligence for faster answers to sourcing questions
Abi is now supercharged with GPT4 AI engine. Enjoy the ease of ChatGPT, now on Abi
Cross-border E-commerce North America Suppliers

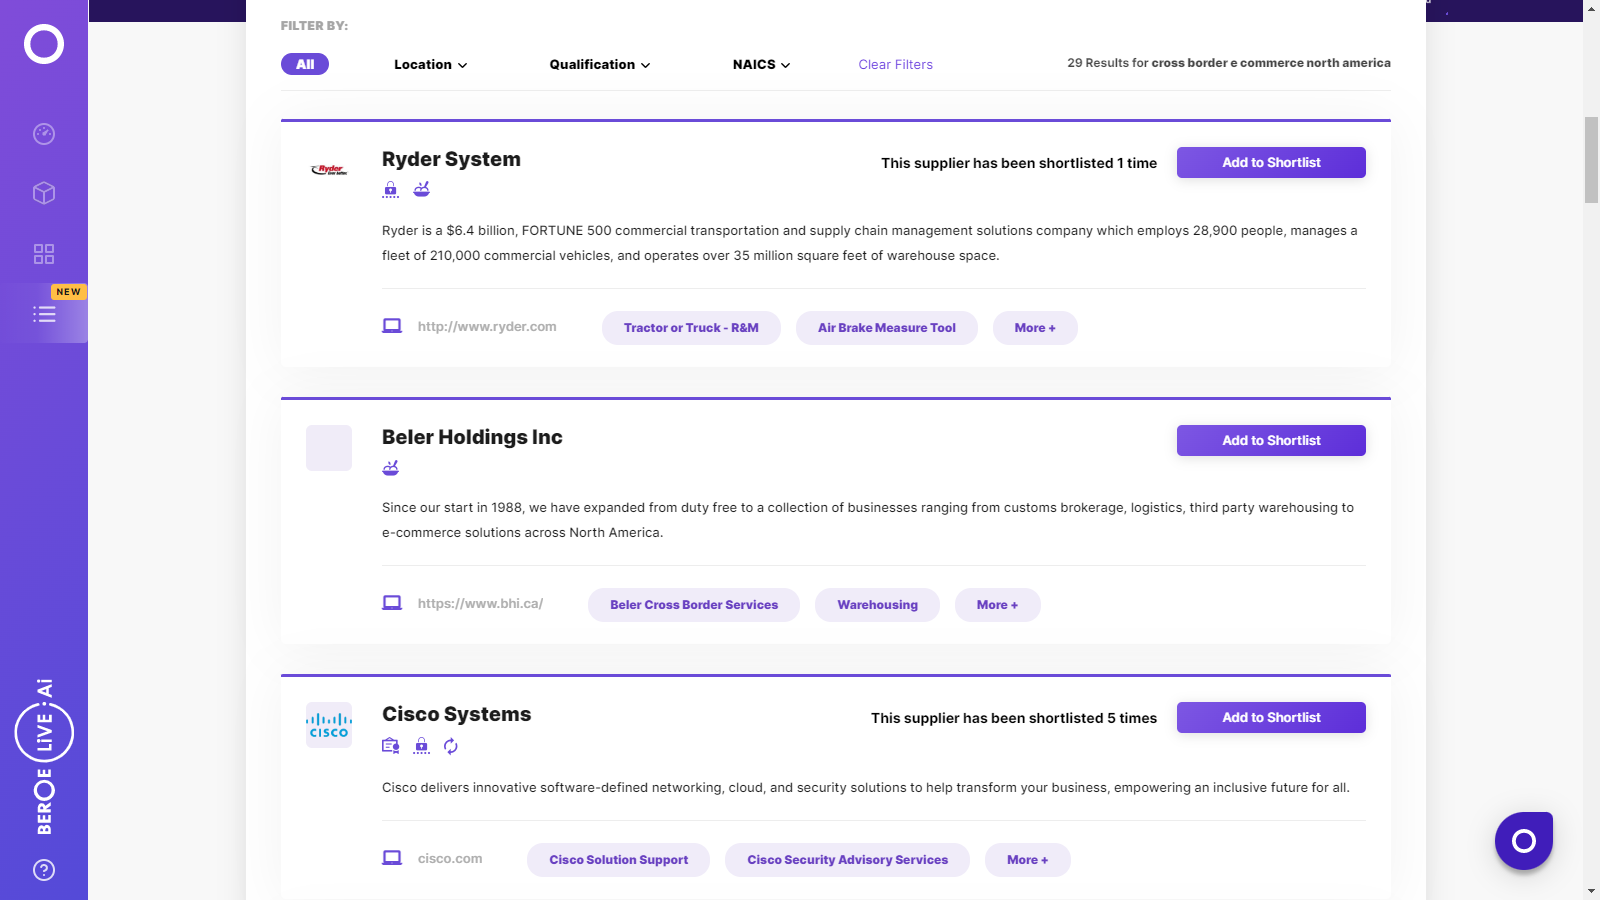
Find the right-fit cross-border e-commerce north america supplier for your specific business needs and filter by location, industry, category, revenue, certifications, and more on Beroe LiVE.Ai™.
Schedule a Demo


Use the Cross-border E-commerce North America market, supplier and price information for category strategy creation and Quaterly Business Reviews (QRBs)
Schedule a DemoCross-border E-commerce North America market report transcript
Regional Market Outlook on Cross-border E-commerce
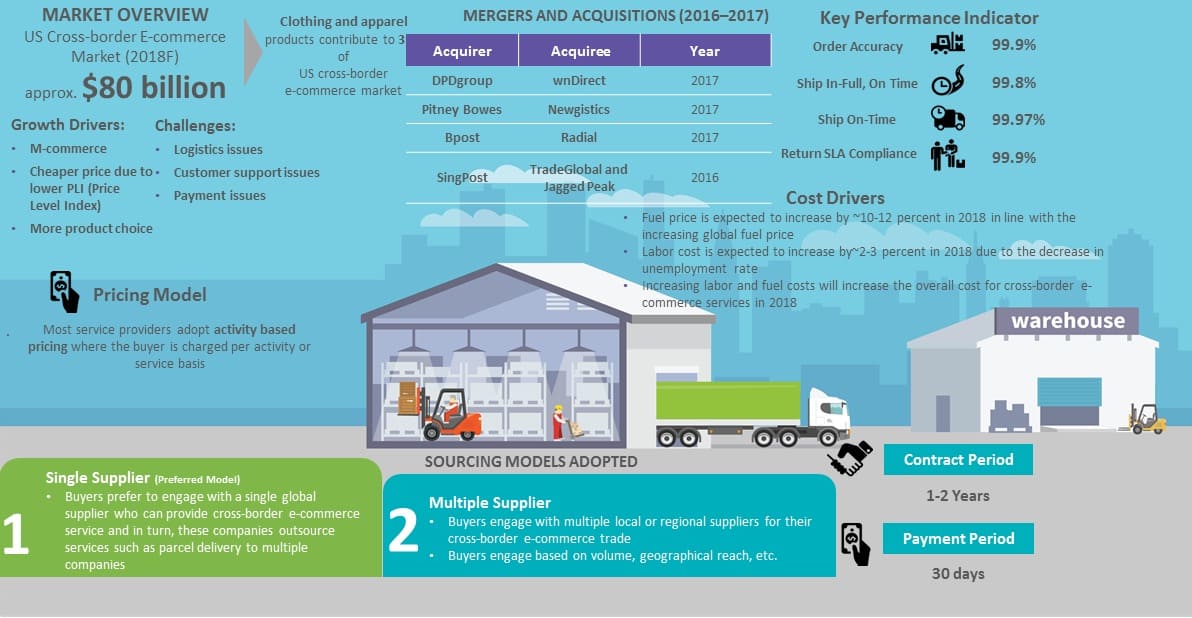
The US cross-border e-commerce revenue is projected to reach $ 80 billion in 2018, with clothing and apparel being the most popular products. With this expanding market , client can expect service availability throughout 2018.
- The US cross-border e-commerce market recorded a revenue of $69.6 billion for 2017, with ~14.8 percent of growth rate compared to 2016. This trend is expected to continue for the year 2018 and the market size is expected to reach $80 billion
- Increase in the number of cross-border consumers is the major driver; approx. 52.9 million US consumers are cross-border buyers in 2017 and by 2020, this is expected to reach 68.6 million
- The US consumers prefer buying from China due to the price

Growth Drivers
With an expected increase in cross-border buyers (from 52.9 million in 2017 to 68.6 million in 2020), driven by m-commerce, product choice and cheaper price, client can expect an increase in cross-border shipments in 2018.
Mobile Commerce
- Presently in the US, mobile devices account for 19 percent of all US retail e-commerce sales. This is expected to increase by 27 percent by 2018
- Nearly half of the US consumers have made cross-border purchase in 2016, with a mobile penetration rate of 103.1 percent
- Due to the growth in mobile commerce, online purchases have become much more easier, thereby saving time
Price
- A country's cross -border merchandise correlates with its average price of goods
- The Price Level Index (PLI) expresses the price level of a given country relative to another. With higher PLI, there is higher opportunity for domestic shoppers to do cross-border shopping
- Currently, the PLI for US is 113 and US consumers mostly shop from UK, China and Canada, whose price level indices are 108, 59 and 107 respectively
Product choice
- Consumers shop from other borders because of the large availability of product choices, which is not available in their country
- Large domestic markets such as Germany, the US and UK, inhibit the need for shopping abroad
Market Challenges and Constraints
A major challenge the client could face in cross-border e-commerce shipments is logistics related issues such as shipping costs, long delivery time, import regulations, and return logistics. client should consider engaging with a supplier who will be able to offer a solution to overcome these challenges.
Shipping and Delivery Challenges
- International shipments include various costs such as border tolls, brokerage fees, duties, inspection fees, storage fees, tariffs and taxes
- As each country has its own set of regulations, it further introduces challenges in cross-border logistics
- With ease of convenience of e-commerce, consumers expect shorter delivery times, real time tracking, security on delivery, etc.
- Difficulty in dealing with reverse logistics, last mile delivery is also one of the major logistics issues with cross-border trade
Payment Issue
- The payment options preferred by the consumers vary based on the countries
- For example, in Japan, a local payment method named “Konbini” accounts for a sixth of e-commerce payments; on the other hand, Spain uses Visa, MasterCard, and American Express, while consumers in Asia prefer OD options
- Hence, accepting the payment options as per each country's requirement is a challenge
Interesting Reads:
Discover the world of market intelligence and how it can elevate your business strategies.
Learn more about how market intelligence can enable informed decision-making, help identify growth opportunities, manage risks, and shape your business's strategic direction.
Get Ahead with AI-Enabled Market Insights Schedule a Demo Now
