CATEGORY
Tuna
Beroe LiVE.Ai™
AI-powered self-service platform for all your sourcing decision needs across 1,200+ categories like Tuna.
Market Data, Sourcing & Supplier Intelligence, and Price & Cost Benchmarking.
Schedule a DemoTuna Market Monitoring Dashboard
Understand the correlation between costs, margins, and prices impacting your category on a real time basis on Beroe LiVE.Ai™
Schedule a DemoTuna Industry Benchmarks
Savings Achieved
(in %)
The average annual savings achieved in Tuna category is 5.30%
Payment Terms
(in days)
The industry average payment terms in Tuna category for the current quarter is 75.6 days
Compare your category performance against peers and industry benchmarks across 20+ parameters on Beroe LiVE.Ai™
Category Strategy and Flexibility
Engagement Model
Supply Assurance
Sourcing Process
Supplier Type
Pricing Model
Contract Length
SLAs/KPIs
Lead Time
Supplier Diversity
Targeted Savings
Risk Mitigation
Financial Risk
Sanctions
AMEs
Geopolitical Risk
Cost Optimization
Price per Unit Competitiveness
Specification Leanness
Minimum Order Quality
Payment Terms
Inventory Control
The World’s first Digital Market Analyst
Abi, the AI-powered digital assistant brings together data, insights, and intelligence for faster answers to sourcing questions
Abi is now supercharged with GPT4 AI engine. Enjoy the ease of ChatGPT, now on Abi
Use the Tuna market, supplier and price information for category strategy creation and Quaterly Business Reviews (QRBs)
Schedule a DemoTuna market report transcript
Global Seafood Market – Overview
The global seafood industry is highly fragmented, with a supply of approx. 180 MMT of fishes annually (both wild caught and aquaculture, 2021) and is estimated to reach 181 MMT in 2022.
-
Fish capture over the decade has taken a more inland approach with the major capture type being aquaculture and tuna, shrimp, salmon are the most captured and traded species
-
Aquaculture currently holds 48 percent of the market share, and it is expected to increase its share in the total capture beyond 50 percent by the end of 2022
Tuna Market Drivers and Constraints
The important driver for the seafood market is the increasing demand from the frozen ready-to-cook seafood industry, while the major constraints currently are the disease outbreaks and the costs incurred in ensuring a disease-free environment.
Drivers
Increasing demand for processed/ready-to-cook seafood:
-
The seafood industry is gaining momentum, due to convenience and time-saving factors
-
Increasing disposable income and per capita consumption are also seen favorable for the growth of the industry
R&D/technology:
-
Aquaculture is gaining dominance over traditional agricultural practices, wild fish harvesting, etc., due to its volume production
Constraints
Shorter shelf life and disease outbreaks:
-
Disease outbreaks can occur both during raising and processing seafood. EMS or Early Mortality Syndrome had caused a substantial decrease in the shrimp production of the leading countries, like China, Vietnam, Indonesia, etc.
Government regulations:
-
Every country has its own control mechanism to prevent overfishing and the exhaustion of its resources. Countries like Thailand and China have fishing quotas and licenses in place, with respect to their fisheries and seafood industry
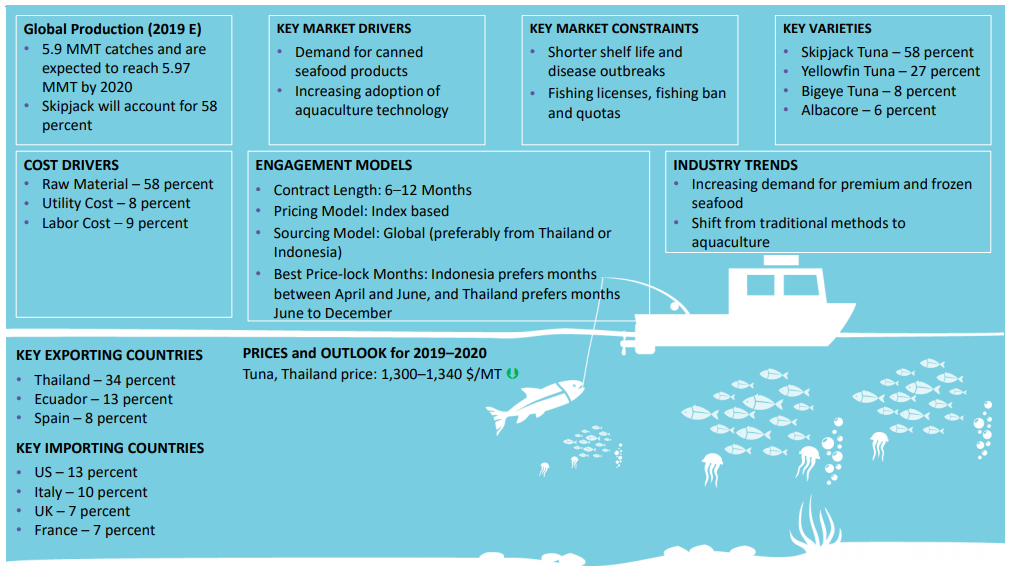
Tuna Global Production
Indonesia is the major supplier of tuna along with other countries like Thailand, South America (Ecuador), and African countries. It produces around 1 MMT of tuna every year. The Pacific Ocean accounted for 66 percent, Indian Ocean 24% and the Atlantic Ocean 8 percent of total tuna catch.
-
Tuna has faced significant issues corresponding to wild stock preservation, ban on FADs, and limited availability of juveniles would stagnate the growth
-
According to Ministry of Marine Affairs and Fisheries, Indonesia is expected to increase its market share by 15 percent of global production, further it has been estimated that the tuna production in Indonesia has increase by around 3.66 percent. Philippines, Ecuador, Spain are other major producing regions.
-
Further, it has been estimated that about 70 percent of the tropical tuna caught worldwide is caught by large purse-seine vessels. In terms of exploitation, 13 percent of stocks worldwide require stronger management and 65% of stocks are at a healthy level of abundance on a worldwide scale; whereas 87 percent of the tonnage of tuna caught has a low fishing mortality rate
Skipjack Tuna Trade Analysis
About 50 percent of the world’s supply of Skipjack comes from the waters of the eight Pacific Island countries, which are part of Parties to the Nauru Agreement (PNA).
-
In 2021-22, the Japan and US remains the net importer of Skipjack Tuna products imported (around 13 percent), followed by the European countries, like France, Spain, Italy, and Netherlands that together import close to 30 percent
-
Majority of Skipjack shipments come from Thailand, which exports 38 percent of the world’s Skipjack Tuna
-
Thailand is, by far, the largest exporter of processed tuna. Ecuador and Spain follow a similar trend
-
Indonesia and the Philippines increased their exports as well, though below 50 percent
-
A majority of the Skipjack Tuna caught at Western Central Pacific Ocean comes to Thailand and Philippines for canning, then, it gets exported to the major consuming regions
-
Major traditional markets for canned tuna are the US, the EU, Egypt, and Japan. Consumption had been stagnant in these countries over this decade, with only a marginal increase. Rising consumption in less traditional markets of Latin America and the Near East with 50 percent increase in imports over the last five years
Interesting Reads:
Discover the world of market intelligence and how it can elevate your business strategies.
Learn more about how market intelligence can enable informed decision-making, help identify growth opportunities, manage risks, and shape your business's strategic direction.