CATEGORY
Sodium Cyanide
The sodium cyanide market size is expected to expand steadily until 2022, driven by demand from the mining sector. The market growth, in terms of volume, is higher than that of the growth, in terms of dollar value, mainly due to the prevailing excess supply.
Beroe LiVE.Ai™
AI-powered self-service platform for all your sourcing decision needs across 1,200+ categories like Sodium Cyanide.
Market Data, Sourcing & Supplier Intelligence, and Price & Cost Benchmarking.
Schedule a DemoSodium Cyanide Market Monitoring Dashboard
Understand the correlation between costs, margins, and prices impacting your category on a real time basis on Beroe LiVE.Ai™
Schedule a DemoSodium Cyanide Industry Benchmarks
Savings Achieved
(in %)
The average annual savings achieved in Sodium Cyanide category is 3.30%
Payment Terms
(in days)
The industry average payment terms in Sodium Cyanide category for the current quarter is 96.0 days
Compare your category performance against peers and industry benchmarks across 20+ parameters on Beroe LiVE.Ai™
Category Strategy and Flexibility
Engagement Model
Supply Assurance
Sourcing Process
Supplier Type
Pricing Model
Contract Length
SLAs/KPIs
Lead Time
Supplier Diversity
Targeted Savings
Risk Mitigation
Financial Risk
Sanctions
AMEs
Geopolitical Risk
Cost Optimization
Price per Unit Competitiveness
Specification Leanness
Minimum Order Quality
Payment Terms
Inventory Control
The World’s first Digital Market Analyst
Abi, the AI-powered digital assistant brings together data, insights, and intelligence for faster answers to sourcing questions
Abi is now supercharged with GPT4 AI engine. Enjoy the ease of ChatGPT, now on Abi
Use the Sodium Cyanide market, supplier and price information for category strategy creation and Quaterly Business Reviews (QRBs)
Schedule a DemoSodium Cyanide market frequently asked questions
As per Beroe's analysis, 3 leading suppliers of sodium cyanide are Anhui Shuguang, Cyanco, and Hebei Chengxin.
According to Beroe Inc, the two key players that rule the sodium cyanide market based on their production size are Europe and the Asia Pacific. Europe and Asia Pacific sodium cyanide market valuation stands at 1,04,000 MT and 6,10,000MT respectively with the bottom two places captured by Latin America at 17,000 MT and North America at 0.94 MT
The widely used formulae for determining the industrial pricing of sodium cyanide is given by: Sodium Cyanide Price = Feedback Cost + Conversion Cost + Producer Margin It's interesting to note that the contract prices of sodium cyanide are fixed, based on the feedstock cost and the conversion involved in the manufacturing of resin.
Since there's a considerable demand from the mining sector, the market size of sodium cyanide promises a steady growth until 2022. The market growth (in terms of volume) is greater than that of the growth of dollar value due to excess supply. Both South Korea and Australia are the leading sodium cyanide manufacturers who import the majority of their supplies to Africa. The general production cost of sodium cyanide is lower in the U.S. and Australia due to low raw material costs. Other than production cost, both utility cost and labor cost contribute about 9 ' 16 percent and 3 ' 7 percent of share respectively in the total production cost.
Sodium Cyanide market report transcript
Global Sodium Cyanide Market Outlook
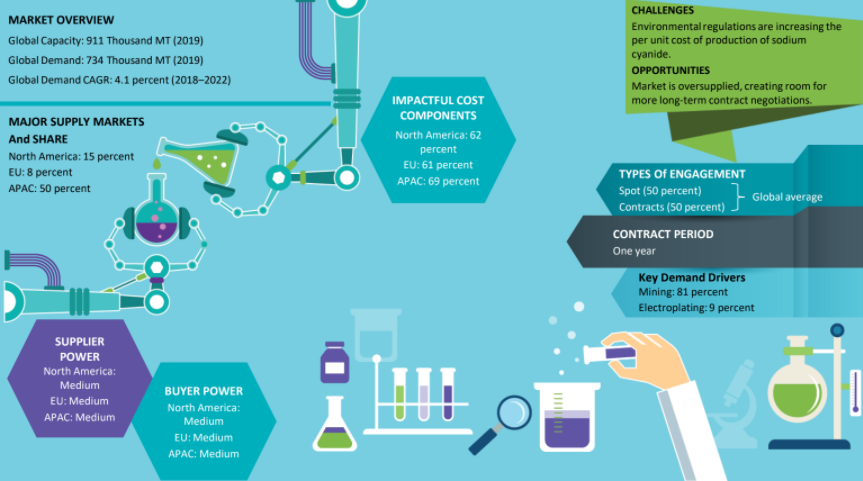
MARKET OVERVIEW
Global Capacity: 953 Thousand MT (2022-F)
Global Demand: 678 Thousand MT (2022-F)
Global Demand CAGR: 3-4 percent (2022–2026)
-
The global sodium cyanide capacity stood at 953 Thousand MT during 2023. There is sufficient installed capacity and supply in major markets, like the US, Europe, and APAC
-
No major capacity expansions are expected until 2026 across all the regions
Global Capacity–Demand Analysis : Sodium Cyanide
Sodium cyanide demand from the gold mining industry constitutes only for approx. 7–8 percent of the total cyanide demand. Sodium cyanide is a low-volume buying downstream segment for both the caustic soda and ammonia markets.
Capacity
-
The global sodium cyanide market is oversupplied with 133 Thousand MT of excess capacity in 2023
-
The capacity-demand is expected to contract towards 2026, as no new capacity additions have been planned across the globe
Demand
-
High demand for precious metals, especially in regions, like Africa, APAC, and Oceania, is driving the growth of metal mining industries, further increasing the demand for the sodium cyanide market
-
Overall, gold mining is expected to be the major demand driver, with nearly 85 percent market share in 2021 and the trend to continue in the upcoming years
Global Demand by Application : Sodium Cyanide
-
Demand share of Mining industry buyers has further increased during 2021, amidst the rise in demand for precious metals post the COVID pandemic
-
Demand from small-volume applications, like chemical intermediates and performance materials, is expected to be steady
-
Growth in demand for sodium cyanide from electroplating is expected to slowdown, owing to the increasing awareness about its ill effects. Overall, buying trends to drop in 2023
Downstream Demand Outlook
Mining Industry
-
Increasing mining activities are demand drivers for sodium cyanide. More than 90 percent of the global gold-producing companies utilize sodium cyanide for the extraction of gold
-
Given the volume and better pricing recieved by sodium cyanide producers from the mining industry, buyers from the sector will hold the maximum negotitation potential
Electroplating
-
Sodium cyanide for its better blending properties is being widely used in electroplating applications
-
The demand for sodium cyanide is expected to decrease, as it is being increasingly replaced by other product-specific subsititutes
-
Growth in demand for sodium cyanide from electroplating is expected to comedown, prevailing its increasing awareness about its ill effects
-
Demand from other industries, like research, chemical intermediates, and performance additives, is expected to remain high
Industry Drivers and Constraints : Sodium Cyanide
Drivers
Mining Activity and Investment Markets
-
Growing mining activities across the globe contribute to the rising demand for sodium cyanide
-
Any unfavorable movement in the cash market would increase the investment in gold and other precious metals. This, in turn, would increase the demand for sodium cyanide by manifold
Constraints
Environmental Regulations
-
Stringent environmental regulations had increased the production cost of sodium cyanide. Regulations have impacted both production and distribution of the material
Fed Interest Rate fluctuation
-
Increase of Federal interest rate is expected to have negative impact on the overall gold demand in 2023. Due to higher interest rates, some of the buyers have invested in the US dollars than gold which impacted the sodium cyanide demand during 2023.
Sodium Cyanide Cost Structure Analysis
-
Raw material, especially hydrogen cyanide, is the major price driver of sodium cyanide. The production cost of sodium cyanide is lower in the US and Australia when compared to other regions, due to low raw material cost.
-
Raw material cost accounts for 65–68 percent of the total production cost, out of which, hydrogen cyanide accounts for 48 percent and 43 percent in Australia and the US, respectively
-
Utility cost contributes to about 9–16 percent of the total production cost because of its energy-intensive process
-
Indirect cost contributes to about 15–21 percent of the total production cost
-
Labor cost contributes to about 3–7 percent of the total production cost
Why You Should Buy This Report
The report gives the global and regional market outlook, supply-demand trend analysis, and Porter’s five force report of areas like North America, Europe, and Asia. It lists out the sodium cyanide industry drivers and constraints, as well as about sodium cyanide price, and provides the cost structure analysis of sodium cyanide. It gives supplier profile and SWOT analysis of key global players like Anhui Shuguang Chemical Group, Cyanco, Hebei Chengxin, and more.
Interesting Reads:
Discover the world of market intelligence and how it can elevate your business strategies.
Learn more about how market intelligence can enable informed decision-making, help identify growth opportunities, manage risks, and shape your business's strategic direction.