CATEGORY
Robotics
Beroe LiVE.Ai™
AI-powered self-service platform for all your sourcing decision needs across 1,200+ categories like Robotics.
Market Data, Sourcing & Supplier Intelligence, and Price & Cost Benchmarking.
Schedule a DemoRobotics Market Monitoring Dashboard
Understand the correlation between costs, margins, and prices impacting your category on a real time basis on Beroe LiVE.Ai™
Schedule a DemoRobotics Industry Benchmarks
Savings Achieved
(in %)
The average annual savings achieved in Robotics category is 5.90%
Payment Terms
(in days)
The industry average payment terms in Robotics category for the current quarter is 60.0 days
Compare your category performance against peers and industry benchmarks across 20+ parameters on Beroe LiVE.Ai™
Category Strategy and Flexibility
Engagement Model
Supply Assurance
Sourcing Process
Supplier Type
Pricing Model
Contract Length
SLAs/KPIs
Lead Time
Supplier Diversity
Targeted Savings
Risk Mitigation
Financial Risk
Sanctions
AMEs
Geopolitical Risk
Cost Optimization
Price per Unit Competitiveness
Specification Leanness
Minimum Order Quality
Payment Terms
Inventory Control
The World’s first Digital Market Analyst
Abi, the AI-powered digital assistant brings together data, insights, and intelligence for faster answers to sourcing questions
Abi is now supercharged with GPT4 AI engine. Enjoy the ease of ChatGPT, now on Abi
Robotics Suppliers
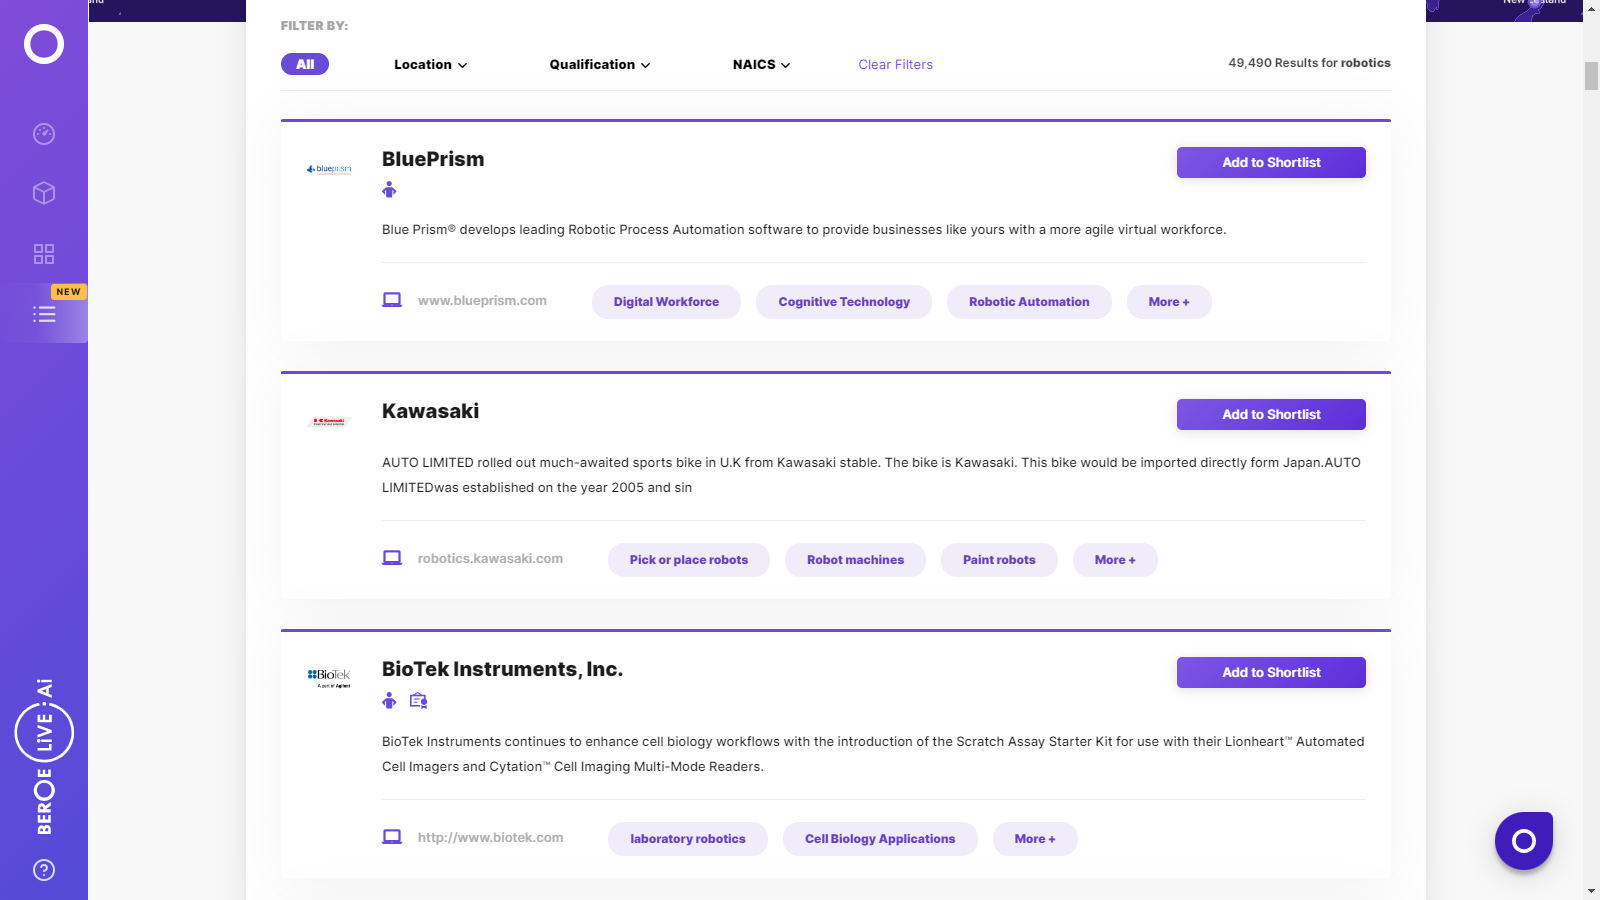
Find the right-fit robotics supplier for your specific business needs and filter by location, industry, category, revenue, certifications, and more on Beroe LiVE.Ai™.
Schedule a Demo

Use the Robotics market, supplier and price information for category strategy creation and Quaterly Business Reviews (QRBs)
Schedule a DemoRobotics market frequently asked questions
The valuation of robotic systems from a global market perspective is valued at $35 billion, and as per Beroe's report, the industry is estimated to touch a valuation of $68 billion growing at a CAGR of 14 percent.
The highest count of industrial robots ever sold stands at 2,54,000 units which is the largest number ever recorded per year, and it's expected to touch 4.30 lakh units.
According to Beroe's analysis, China, South Korea, Japan, the US, and Germany are the top five key players, with China contributing nearly 27 percent.
The current global market size is nearly $15.8 billion, and it's estimated to reach a valuation of $33.8 billion by 2025 growing at a CAGR of 11.5 percent.
As per the industrial robotics market analysis report shared by Beroe, these are the top global service providers of the industry: Fanuc Yaskawa ABB Kawasaki Nachi Denso Kuka
The primary factor that increased the demand for industrial robots is that companies are trying to improve the productivity of their complex production lines and are also trying to save cost, improve manufacturing flexibility using automation.
The main components of the robot include: Controller Drive Robotic arm Sensors End effector
The average robot density (number of robots per 10,000 employees) for Europe, America, and Asia is 92, 86, and 57 respectively.
The rapid modernization and recent investment in the new production lines by major automotive markets led to the rise of robot sales and installations within the industry at a CAGR of 20 percent. Since the manufacturers are also trying to make the best out of new material and develop energy-efficient drive systems combined with high competition across major car markets, the automotive industry is perfect for investing and drives the market growth.
According to Beroe's report, the industrial robotics market size varies based on individual countries. For Europe, the production size is 50,073 units and it has a growth rate of 15% CAGR. Similarly, the North American and Latin American market produces 36,000 and 1587 units and has a growth rate of 18 ' 19% CAGR and 9 ' 10& CAGR respectively. The APAC robotic market size shows a growth rate of 15 -16% annually.
Robotics market report transcript
Global Market Outlook on Robotics
-
The global market size of industrial robots was estimated at $28.20 billion in 2022* and it is forecast to reach $37.80 billion by 2025
-
The industry is expected to grow by a CAGR of 10.26 percent during the forecast period
-
As per Association for Advancing Automation, robot orders in Q1 2021 were 19.6 percent higher than the same period in 2020*, in spite of the COVID-19 pandemic slowing down the global economy last year
-
China is the major demand market for robotics, with an estimated market share of approx. 37 percent in 2020
-
China, South Korea, Japan, the US, and Germany are the five major markets, and they contributed to about 80 percent demand of the global industrial robot sales volume in 2020
-
Collaborative robots (cobots) are moving towards heavy-duty material handling, part-handling, machine tending, etc., as compared to their previous small payloads and lighter applications
-
The world robotics market is witnessing notable changes with the usage of robots beyond industrial production floors. Today, robots are adapting to the roles of surgical robots, cooking robots, personal assistants, exoskeletons, delivery vehicles, autonomous vehicles, exoskeletons, and unmanned aerial vehicles, etc.
-
Although, there is a rising demand for industrial robots anticipated in the future; 2020 experienced a decline in new robot sales due to a weak consumer demand from the automotive and electronics industry users. This was mainly attributed to a damp economic environment, US-China trade tensions, and a low investment confidence. Even the demand for new electric vehicle (EV) manufacturing lines and in service areas such as intra-logistics was unable to offset the headwinds from the aforementioned markets.
Industrial Robotics-Market Overview
-
The global market for industrial robots (comprising of traditional industrial robots and collaborative robots only) is expected to be valued at $28.20 billion by the end of 2022*, and it is forecasted to grow at a CAGR of 10.26 percent to reach about $37.80 billion by 2025.
-
Asia, specifically China, has historically been the largest buyers of industrial robot technology. China leads the position as the biggest market, with a share of 37 percent, followed by markets of Japan and South Korea
-
There is an increase in demand for industrial robots in the recent years, as companies are striving to improve the productivity of their complex production lines, along with cost savings, improving quality, and increasing manufacturing flexibility by means of automation
-
Recent trends in industrial robotics have led to introduction of innovative technical improvements with robots possessing human traits, such as artificial intelligence, object recognition, flexibility, and learning ability, which are fast adopted by manufacturing companies
-
Over the next 7–8 years, it is anticipated that the install base of industrial robots will increase in almost every single country, but China and North America are forecasted to witness the fastest adoption of industrial robots
Industrial Robotics End-user Market Share, By Consumption (2022*)
-
The global demand for electronic devices and components decreased substantially, due to the US–China trade crisis, as Asian countries are leaders in manufacturing electronic products and components
-
The automotive industry is the second largest adopter of industrial robots, with an estimated market share of 28 percent in 2022. Major growth drivers for this industry is attributed to investments in new car production capacities and in modernization. Using new materials, developing energy efficient drive systems, and high competition in all major car markets pushed for investments
-
The metal and machinery industry is the third largest customer industry of industrial robots. Global installations are expected to account for 8 percent of total demand by the end of 2022*. In the recent years, the producers of metal products (without automotive parts) and the producers of industrial machinery, bought substantial amounts of robots.
-
The metal and machinery industry is the largest customer industry of industrial robots in Finland (44 percent), Sweden (42 percent), Switzerland (40 percent), Belgium (30 percent), Austria (27 percent), Italy (26 percent) and Denmark (21 percent)
Global Drivers and Constraints : Robotics
Drivers
Demand from the Manufacturing Sector:
-
The perpetual need to modernize manufacturing facilities to tackle the increasing labor costs, an aging workforce and increasing focus on productivity and quality will drive the demand for robots in the manufacturing sector
-
Further, the industry’s shift toward automation, to aid in mass customization and shorter product life cycles, is set to drive the growth for the robotics market globally
Internet of Robotic Things (IoRT):
-
Recent technological advancements in robotics and AI have led to the introduction of IoRT, which make use of devices to fuse sensor data from multiple sources and use intelligence to determine the course of action. As Industry 4.0 is expected to play a pivotal role in global manufacturing, IoRT will help in more efficient and easier methods for robotic manipulation and grasping in manufacturing functionalities, leading to increased use of robotics
Collaborative Robots:
-
Collaborative robots are light, cost effective and adaptive, work, along with human workers and assisting them with a variety of tasks without the need for safety barriers; this is set to drive the robotic market in the coming years, as most manufacturers are eager to adopt this technology, as it is projected to have a quick return on investment of over five months
Constraints
High Cost of Robotics:
-
High initial costs involved in the set-up of robots’ hamper the growth of the market, as it takes a longer period to recover the ROI
Damp Economic Climate:
-
Uncertain economic trade-wars like the US-China tariff increase has affected the industry with an increased price of robotics and automation components and parts. As a result, small and medium-sized companies might hinder from investing in automation due to lack of funds
-
Also, the COVID-19 epidemic, that originated in China, has disrupted global supply chains worldwide, affecting OEMS across multiple industries since the origin in December 2019
Availability of Low Cost Labor across Developing Economies:
-
The availability of low cost labor across developing countries has hindered the growth of the robotics market
Cost Structure – Industrial Robot System
It has been observed that the cost of industrial robots is decreasing in spite of labor cost becoming more expensive. As production of robots shifts to special economic zones and low-cost regions; robot demand experiences a compounding effect on their cost.
Future Cost Trends
-
Robot (includes software) – Minimal decline is expected, as pricing is close to material cost for high purchase volume automotive industry.
-
Peripherals – Parts, such as sensors, safety systems or barriers, etc., are anticipated to witness additional Drop, due to the removal of safety barriers.
-
Systems Engineering – Includes programming, installation, etc. The decrease in this area is expected to Slow, due to the association of minimum cost of installation.
-
Project Management – It has always occupied 5–10 percent of the total system cost. Further decline is expected in the near future.
Why You Should Buy This Report
The report provides information on the robotics industry market size, drivers and constraints, industrial robotics market analysis, and Porter’s five forces analysis for the global robotics market. It gives the regional market outlook for North America, Europe, APAC, etc. It lists out the different types of industrial robots, and industrial robot market size. This industrial robotics market analysis report details the major technological breakthroughs in the robotics industry and gives the profiles of key players like ABB, Kawasaki, Fanuc, etc. It gives information on the Internet of Robotic Things (IoRT).
Interesting Reads:
Discover the world of market intelligence and how it can elevate your business strategies.
Learn more about how market intelligence can enable informed decision-making, help identify growth opportunities, manage risks, and shape your business's strategic direction.
Get Ahead with AI-Enabled Market Insights Schedule a Demo Now