CATEGORY
Condition Monitoring And NDT Services
Condition monitoring is the process of monitoring a parameter of condition in a machinery such as vibration, temperature etc. In order to identify a significant change which is indicative of a developing fault. NDT is a wide group of analysis techniques used in science and technology industry to evaluate the properties of a material, component or system without causing damage.
Beroe LiVE.Ai™
AI-powered self-service platform for all your sourcing decision needs across 1,200+ categories like Condition Monitoring And NDT Services.
Market Data, Sourcing & Supplier Intelligence, and Price & Cost Benchmarking.
Schedule a DemoThe World’s first Digital Market Analyst
Abi, the AI-powered digital assistant brings together data, insights, and intelligence for faster answers to sourcing questions
Abi is now supercharged with GPT4 AI engine. Enjoy the ease of ChatGPT, now on Abi
Condition Monitoring And NDT Services Suppliers
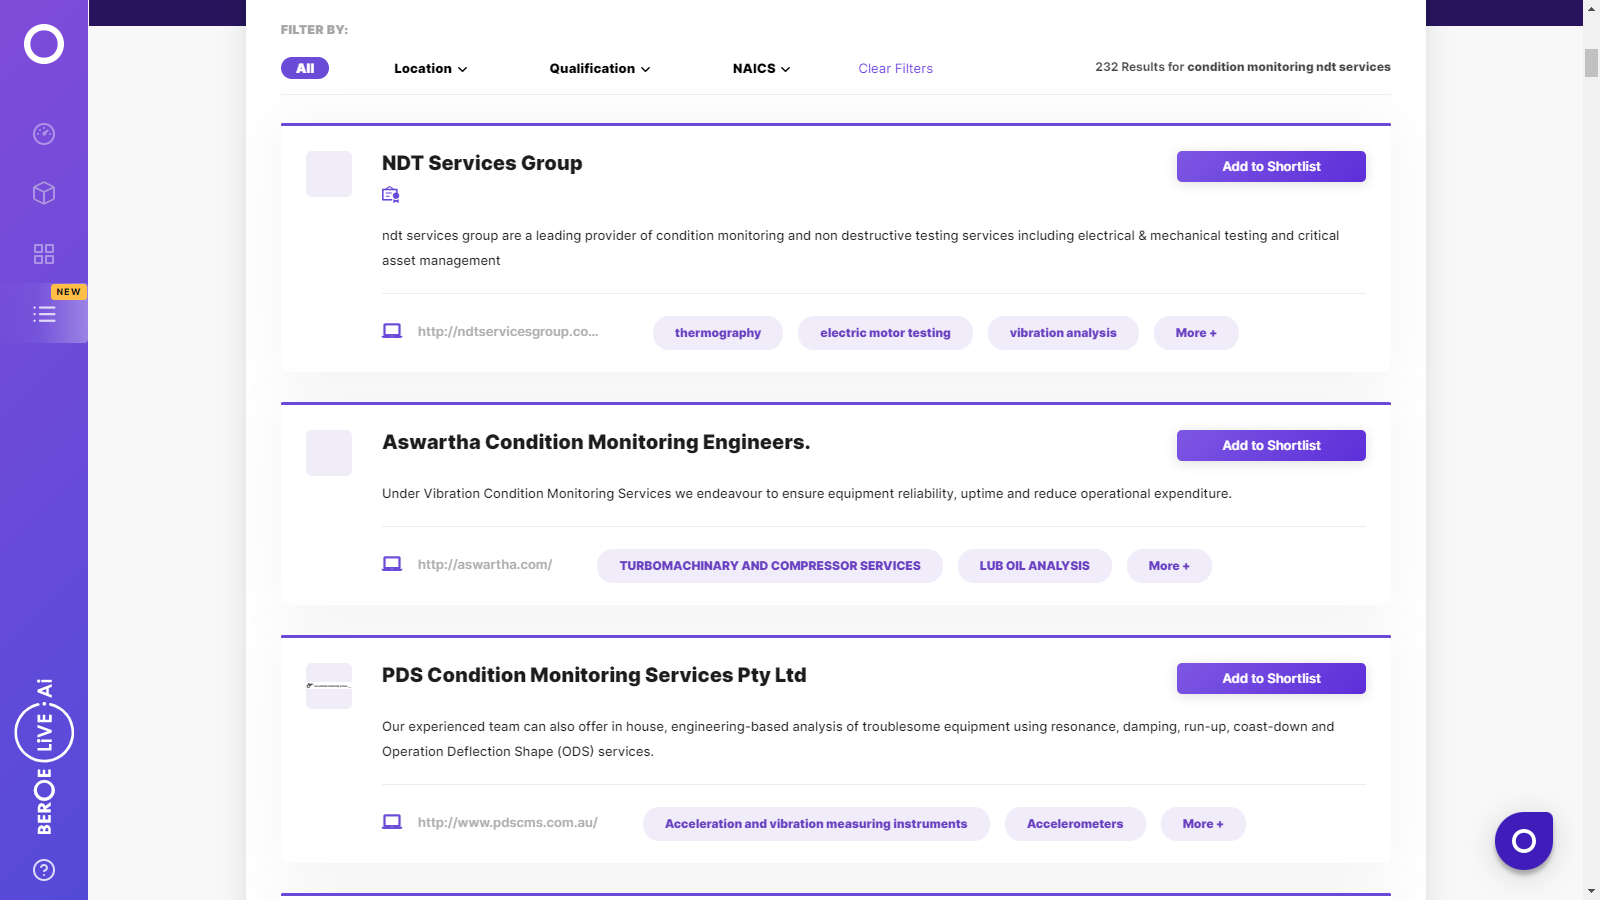
Find the right-fit condition monitoring and ndt services supplier for your specific business needs and filter by location, industry, category, revenue, certifications, and more on Beroe LiVE.Ai™.
Schedule a Demo

Use the Condition Monitoring And NDT Services market, supplier and price information for category strategy creation and Quaterly Business Reviews (QRBs)
Schedule a DemoCondition Monitoring And NDT Services market report transcript
Global Market Outlook on Condition Monitoring And NDT Services
- Global condition monitoring market is expected to reach $ 2.45 billion by 2020. It is projected to grow at a CAGR of 7.6 percent
- North America and Asia Pacific are the major markets for these services due to the presence of end-user industries like oil & gas and mining
- Escalating the cost of machine failures, the need to maintain high uptime of the equipment and prevent any unwanted machine break down are the major drivers of the condition monitoring services
- Asian Pacific is the ‘high growth' market segment because of the presence of the major end-user industries and increased adoption of predictive maintenance strategy by the corporates
Non-destructive Testing Market Overview
- Global NDT product and services market is expected to reach $ 9.68 billion by 2020. It is projected to grow at a CAGR of 8.6 percent
- North America and Asia Pacific are the major markets for these services due to the presence of end-user industries like oil & gas and mining
- Escalating the cost of machine failures, the need to comply with stringent regulations and expanding applications in petrochemical and manufacturing industries are the major drivers of the NDT services. Asia Pacific is the fastest growing market and it is projected to grow at a CAGR of 10 percent
- Regulations and Standards: Vendors offering condition monitoring and NDT services should be ISO 9001 certified and have accreditation from the National Association of Testing Authorities (NATA). NATA provides assessment, accreditation and training services to laboratories and technical facilities. NATA monitors members' compliance with the OECD Principles of Good Laboratory Practice (GLP). NATA formally recognizes whether facilities produce reliable technical results
- Technicians certified by the International Rope Access Trade Association (IRATA) are mostly preferred
Cost Drivers & Pricing Models
Technician charges are the major cost drivers in the overall cost of the NDT services
Field services such as inspection services are charged at day rates while lab services are charged at per sample model
Pricing Models prevailing in the industry
- There are two types of pricing models that are standard while offering NDT and condition monitoring services
- Day rate model: All field services are charged at day rates Ex: Inspection services are charged at A$ XXX/ day
- Per unit or sample model: Laboratory testing services are charged at unit or per sample rates. Ex: Oil analysis is charged at A$ XXX/unit or sample tested
Margins:
- Rates are locked in case of long term relationships with planned predictive maintenance
- Vendors often charge 10 percent margins in this industry while sub contractor gets 5 percent
- Technician fee involves the technician entitlements, benefits, employer cost (food and stay)
- Equipment usage cost not only includes the NDT and inspection devices but also the personal protective equipment given to the technician to carry out the inspection
- Other costs includes the cost of consumables that are used in the inspection process
Sourcing Practices and Cost saving opportunities
- Regional and local service providers are often preferred while procuring these services
- Scheduled predictive maintenance offers better cost savings than ad hoc/unplanned requests
Sourcing from Global Suppliers
- If the requirement is global, it is best suited to procure from a global supplier rather than regional suppliers, because global suppliers will have much more visibility into applicable regulations for various geographies and have vast geographic presence. Consolidated spend could earn discounts on the pricing
Sourcing from Regional Suppliers
- If the requirement is for a regional scope or for local demand, it is best suited to procure from regional suppliers rather than global suppliers as it would incorporate cost savings and the repair and maintenance of the equipment would be easier
Cost saving opportunities: Scheduled predictive maintenance offers better cost savings as the vendor is aware of the requirement in the near term. Vendors can allot his resources in way to reduce the overall cost of providing these services. Ad-hoc/unplanned predictive maintenance always costs higher as a vendor has limited time to allocate the resources.
Interesting Reads:
Discover the world of market intelligence and how it can elevate your business strategies.
Learn more about how market intelligence can enable informed decision-making, help identify growth opportunities, manage risks, and shape your business's strategic direction.
Get Ahead with AI-Enabled Market Insights Schedule a Demo Now