CATEGORY
Rice
Global rice production has been fairly stable with marginal increases over the years, with current supply considered to be surplus to demand. There are several varieties of rice and the supplier market is classified based on the type of variety offered by the individual suppliers
Beroe LiVE.Ai™
AI-powered self-service platform for all your sourcing decision needs across 1,200+ categories like Rice.
Market Data, Sourcing & Supplier Intelligence, and Price & Cost Benchmarking.
Schedule a DemoCategory Alerts
Rising supply concerns for Indian rice seen exerting upward pressure on prices
August 22, 2022Sluggish demand supports a downtick in India rice export prices
August 16, 2022Bangladesh cuts import duty to 25% from 62% to cool surging domestic prices
July 04, 2022Become a Beroe LiVE.Ai™ Subscriber to receive proactive alerts on Rice
Schedule a DemoRice Market Monitoring Dashboard
Understand the correlation between costs, margins, and prices impacting your category on a real time basis on Beroe LiVE.Ai™
Schedule a DemoRice Industry Benchmarks
Savings Achieved
(in %)
The average annual savings achieved in Rice category is 5.30%
Payment Terms
(in days)
The industry average payment terms in Rice category for the current quarter is 75.6 days
Compare your category performance against peers and industry benchmarks across 20+ parameters on Beroe LiVE.Ai™
Category Strategy and Flexibility
Engagement Model
Supply Assurance
Sourcing Process
Supplier Type
Pricing Model
Contract Length
SLAs/KPIs
Lead Time
Supplier Diversity
Targeted Savings
Risk Mitigation
Financial Risk
Sanctions
AMEs
Geopolitical Risk
Cost Optimization
Price per Unit Competitiveness
Specification Leanness
Minimum Order Quality
Payment Terms
Inventory Control
The World’s first Digital Market Analyst
Abi, the AI-powered digital assistant brings together data, insights, and intelligence for faster answers to sourcing questions
Abi is now supercharged with GPT4 AI engine. Enjoy the ease of ChatGPT, now on Abi
Use the Rice market, supplier and price information for category strategy creation and Quaterly Business Reviews (QRBs)
Schedule a DemoRice market frequently asked questions
According to the analysis of Beroe Inc, the global rice industry is gradually rising at a steady CAGR of 1.4 percent with decent improvement in the consumption rates. The key factors that drive the net growth include: The consumption of rice as a staple food Considerable growth in regions like India, Vietnam, and Thailand Consistent demand for certain rice varieties from regions like the Middle East since they use it in delicacies and during festive seasons
Global rice production has been increasing steadily at a 2% CAGR over the last five years. The supply during 2020-21 is likely to reach 500 metric million tons (MMT).
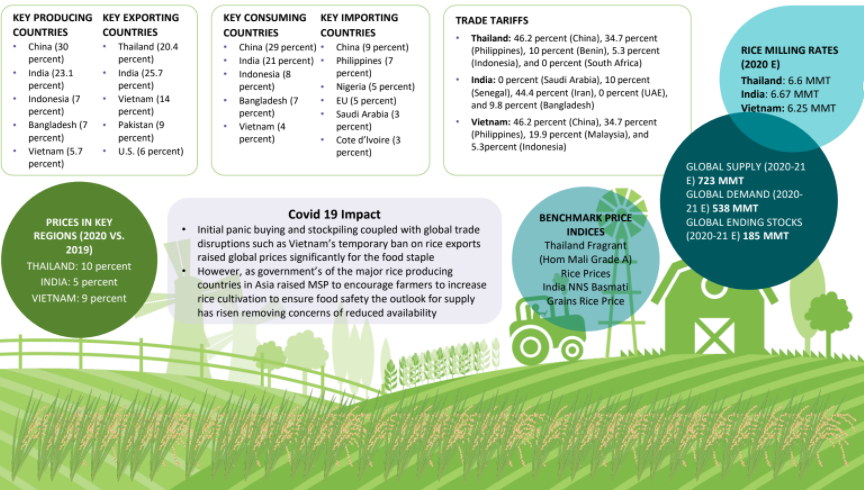
As per Beroe's analysis, India with 27 percent export holds #1 position in the list of exporting countries w.r.t the international rice market. Thailand, Vietnam, Pakistan, and the U.S. are next in line with export capacities of 22 percent, 14 percent, 8 percent, and 7 percent respectively. In terms of import, China leads the list with 11 percent, followed by Bangladesh (7 percent), Nigeria (5 percent), EU (4 percent), and both Saudi Arabia and C'te d'Ivoire at the end with 3 percent import capacity.
The initial panic buying and stockpiling, along with the global trade disturbances, including Vietnam's brief ban on rice exports, has elevated rice prices worldwide.
India's overall production and processing cost for (basmati) rice is around ₹51,951.5 per MT. Land leases and labor costs are the key cost components for rice cultivation in the country. In Thailand, the total rice production and processing costs are nearly US$508.5 per MT, with chemicals and fertilizers making up for the significant proportion.
Rice production and consumption in China, Bangladesh, and Indonesia is equivalent owing to significant local demand. As such, these countries do not play an instrumental role in global rice exports.
According to Beroe's category intelligence report, the rice trade volume has slumped in Iran and Nigeria (by 2%). While Iran has instituted bans and high import duties, Nigeria is gradually shifting toward self-sufficiency.
Rice market report transcript
Global Rice Market Outlook
-
The rice market is estimated to be valued at about $299 billion in 2023 and is expected to grow at a CAGR of about 2.2 percent between 2023 and 2028, driven by strong demand as a staple in consuming regions and expanding applications of processed rice
-
2023/24 rice production is expected to witness an uptick by about 2.5% from the previous year, driven by increased output from markets like India and Thailand. However, weather based and economic challenges in major growing/exporting markets like China and Pakistan will contribute to any lowering in production
-
The key factors driving the growth include the consumption of rice as a staple food and demand for certain rice varieties from regions, like the Middle East, for use in delicacies and during festive seasons
Global Supply–Demand Analysis : Rice
-
2023/24 rice production is expected to witness an uptick by about 2.5% from the previous year, driven by increased output from markets like India and Thailand. However, weather based and economic challenges in major growing/exporting markets like China and Pakistan will contribute to any lowering in production
-
Although Bangladesh, China, and Indonesia rank highest in production, their consumption volume is equivalent. Therefore, these countries do not set the trends in the rice market as opposed to Thailand, Vietnam, and India, who are major players
-
In H2-2022, a large acreage of farmland in the world’s largest rice producer China were plagued by heavy summer monsoon rains and floods
-
The rice market CAGR is expected to be around 2.2% between 2023 and 2028
-
In the case of major rice producers, like Bangladesh, Indonesia, and China, the consumption volume is close to or higher than the production volume. Therefore, these regions do not play a major role in the global export market
-
Countries, like India, Vietnam, and Thailand, who produce rice in excess of domestic demand, are the key regions influencing global rice trends
Global Demand Analysis : Rice
-
China is the world’s largest producer and consumer of rice. The country does not export rice, as the local demand is high
-
India and Vietnam are the two major rice exporters among the top five consumers of rice. Thailand is the world’s sixth largest rice producer and consumer as well as a major exporter
-
The rice is mainly consumed as a staple food in these countries, and also for the use in delicacies, like biryani
Est. Global Utilization of Rice (2023)
-
The total supply of rice is estimated to drop by approx. 1.7 percent compared to last year
-
The global consumption of rice is expected to increase by approx. 0.2 percent compared to last year
-
The global exports of rice is projected to dip by approx. 2 percent compared to last year
-
The global-ending stocks of is seen to contract by approx. 6.6 percent compared to last year
Est. Rice Consumption by Country (2023)
-
Among the top five producers of rice, India and Vietnam are the major exporters, where local consumption does not override the export demand
-
These countries, along with Thailand, normally influence the global market trends for rice
-
The local demand mainly comes from the utilization of rice as a staple food and in special dishes as a delicacy
Global Rice Trade Dynamics
-
India accounts for 37 percent of global rice exports followed by Thailand which accounts for 14 percent. India’s rice exports is likely to witness some restrictions owing to the recent export duty of 20% levied by the Indian government in order to stabilize the domestic market
-
The export share of Thailand has increased only by 4–5 percent over a five-year period, while India has grown by 1–2 percent and stands as the world’s top exporter of rice
-
Thailand had been major sourcing destination, due to the potential for Thai aromatic rice to be used as a substitute for Indian basmati rice, with the former being available at more competitive prices
-
China is the largest importer of rice, despite being the top rice producer, due to high demand
-
Nigerian rice imports have dropped by 2 percent over a five-year period, as the country aims to restrict imports and become self-sufficient
-
The Saudi Arabian imports have increased by 0.4 percent in five years, as the region is a major importer of basmati rice, which is used in the preparation of delicacies during the festive seasons
Cost Structure Analysis - Rice
-
The surging fertilizer costs and fuel costs are likely to challenge rice growers in 2023/24 and add to input costs. The higher milling /operations cost also supports any price increases in rice production
Interesting Reads:
Discover the world of market intelligence and how it can elevate your business strategies.
Learn more about how market intelligence can enable informed decision-making, help identify growth opportunities, manage risks, and shape your business's strategic direction.