CATEGORY
Ocean Freight Services
Beroe LiVE.Ai™
AI-powered self-service platform for all your sourcing decision needs across 1,200+ categories like Ocean Freight Services.
Market Data, Sourcing & Supplier Intelligence, and Price & Cost Benchmarking.
Schedule a DemoCategory Alerts
Carriers plan for Freight and BAF increase ahead of the peak season.
April 10, 2023Turkey's port was severely damaged and containers are overturned.
February 06, 2023MSC container vessel grounded at the entrance of the Italian port
January 10, 2023Become a Beroe LiVE.Ai™ Subscriber to receive proactive alerts on Ocean Freight Services
Schedule a DemoOcean Freight Services Industry Benchmarks
Savings Achieved
(in %)
The average annual savings achieved in Ocean Freight Services category is 7.00%
Payment Terms
(in days)
The industry average payment terms in Ocean Freight Services category for the current quarter is 55.5 days
Compare your category performance against peers and industry benchmarks across 20+ parameters on Beroe LiVE.Ai™
Category Strategy and Flexibility
Engagement Model
Supply Assurance
Sourcing Process
Supplier Type
Pricing Model
Contract Length
SLAs/KPIs
Lead Time
Supplier Diversity
Targeted Savings
Risk Mitigation
Financial Risk
Sanctions
AMEs
Geopolitical Risk
Cost Optimization
Price per Unit Competitiveness
Specification Leanness
Minimum Order Quality
Payment Terms
Inventory Control
The World’s first Digital Market Analyst
Abi, the AI-powered digital assistant brings together data, insights, and intelligence for faster answers to sourcing questions
Abi is now supercharged with GPT4 AI engine. Enjoy the ease of ChatGPT, now on Abi
Use the Ocean Freight Services market, supplier and price information for category strategy creation and Quaterly Business Reviews (QRBs)
Schedule a DemoOcean Freight Services market report transcript
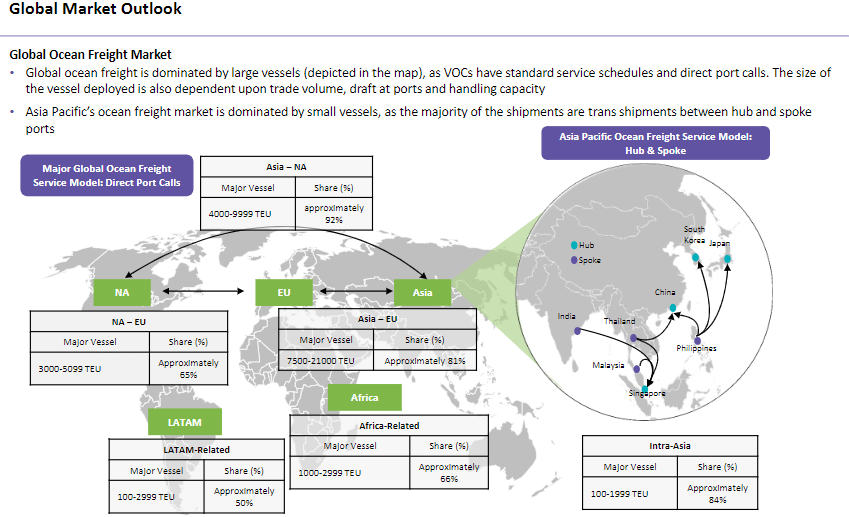
Global Ocean Freight Services Market Analysis and Global Outlook
-
The deployment of high and heavy-capacity vessels accounts for more than 85 percent of the total vessel deployment between Asia and Europe. This reflects the strong demand for large-size vessels
-
The proportion of large and heavy capacity vessels is highly deployed between Asia and Europe, the deployment of capacity is between 12,000 TEUs and 18,000 TEUs
-
Asia Pacific’s ocean freight market is dominated by small vessels, as the majority of the shipments are trans shipments between hub and spoke ports
Global Ocean Freight Services Market Outlook
The ocean container transportation market is dominated by the top five liners. They have global presence and are able to offer services across geographies in a seamless manner
The order book for containerships worldwide is at its highest point ever. The order book-to-fleet ratio increased to 27% in May 2022 from a low of 8.2% in October 2020. The order book as of today, with more than 6.80 MTEU and slightly under 900 vessels, is the greatest in terms of capacity in history. Orders for containerships do not come without risk, especially in light of the recent sharp rise in new building costs at Far Eastern shipyards. Prices for container vessels have increased by 30 to 35% compared to the end of 2020 due to decreasing yard slots, rising steel costs, and growing energy expenses.
Retail sales, industrial production, and net international commerce all fell in the Eurozone in March as a result of the war between Russia and Ukraine's adverse effects on consumer and company confidence. In April, pandemic containment measures were lifted, according to the S&P Global PMI surveys. As the European Union considers extending the ban on energy, imports from Russia to include oil and petroleum products, the downside risk is the potential for further energy supply disruptions that raise prices.
The geopolitical environment has significantly changed as a result of Russia's invasion of Ukraine on February 24. According to HIS Markit's projection, Russia's military assaults are likely to continue in the next few months despite fierce Ukrainian opposition. The result might be a protracted geopolitical deadlock. Russia's real GDP is anticipated to decline 10.2 percent in 2022 and 1.4 percent in 2023 due to sanctions and the exodus of foreign investors before starting a slow recovery. Ukraine's real GDP is expected to recover 46 percent in 2022, 30 percent in 2023, and 14 percent in 2024 as reconstruction moves forward with significant assistance from Western partners.
The ocean container transportation market is dominated by the top five liners. They have global presence and are able to offer services across geographies in a seamless manner
Global Player
-
Highly consolidated players with multi-trade lane offerings. The top service providers have a strong global presence
-
There is a focus on containing fuel costs and maximizing utilization rates of the ships
Regional Players
-
Apart from the top 20-odd global players, there are numerous small operators who operate either regional shuttles or feeder vessels catering to a particular region
-
The 3PL, freight forwarders and NVOCCs market slot spaces to smaller and regional shippers
3PL, freight forwarders and NVOCCs
-
3PL, freight forwarders and NVOCCs obtain slots from the carriers and in turn sell the container spaces to the end shipper
-
Leading firms which function in this space are top 5 global freight forwarders
-
They are able to consolidate volume and offer it to the ocean carriers
End Coustomers
-
Direct sales are employed for high-volume buyers globally
-
A majority of the top suppliers have direct presence in all continents
-
While regional carriers target shippers who use predominantly three to five trade lanes
Global Ocean Freight Services Market Maturity
-
Vessels with a capacity of more than 10,000 TEU depend on freight forwarders or 3PLs to fill space in the container to increase utilization rate, so that cost per TEU will be reduced.
-
Approximately 105 million TEU volume of ocean freight handled by direct engagement with the ocean liners
-
Approximately 12 million TEU handled by top 10 global freight forwarders
-
45–50 million TEU handled by regional or local freight forwarders
The utilization of ocean freight depends on the following factors:
-
Type of transportation requirement
-
Value of the product
-
Time criticality of the product
-
Annual volume of the product
Cost Structure Analysis: Global Ocean Freight 2022
Maximum Impact Drivers
-
Bunker Fuel Costs: The change in global trade resulted in a significant increase of costs to the supply chain, in order to meet the increasing costs, many carriers have not opted to regulate the bunker surcharges
-
Vessel Costs: Typically, the vessel cost includes the cost involved in labor, equipment handled in the vessel, crew cost onboard of a vessel and off-shore personnel cost involved in planning, scheduling, managing and administration of the vessel
Minimum Impact Drivers
-
Terminal Handling Costs: Cargo handling charges in the origin/destination ports are charged for the shippers in the form of THC, which varies from terminal to terminal. There is a marginal difference in THC within the ocean liners
-
Administrative Costs: Documentation charge, security charge and equipment handling fees at both origin and destination vary according to the type of cargo. The complexity of handling the charges would increase relative to the respective terminals, based on the facility available
Why You Should Buy This Report
This freight business intelligence report gives insight into the regional and global markets, key challenges and sustainability practices in the container shipping market. It gives the positioning, financials and SWOT analysis of key ocean container shipping players like APM–Maersk and Hapag‐Lloyd. The report does a cost structure analysis and gives the cost drivers and freight rates. It gives insight into the best ocean freight procurement practices like engagement and sourcing models, procurement strategies, etc.
Interesting Reads:
Discover the world of market intelligence and how it can elevate your business strategies.
Learn more about how market intelligence can enable informed decision-making, help identify growth opportunities, manage risks, and shape your business's strategic direction.