CATEGORY
Glass Bottles
This report covers analysis on Glass Bottles across 4 regions. The demand dynamics and the capacity additions are covered
Beroe LiVE.Ai™
AI-powered self-service platform for all your sourcing decision needs across 1,200+ categories like Glass Bottles.
Market Data, Sourcing & Supplier Intelligence, and Price & Cost Benchmarking.
Schedule a DemoCategory Alerts
EU glass containers industry supports Green Claim Proposal by the European Commission
March 29, 2023O-I to begin construction of $240 million US facility
April 12, 2023O-I prepares to break ground on $240 million US facility
April 05, 2023Become a Beroe LiVE.Ai™ Subscriber to receive proactive alerts on Glass Bottles
Schedule a DemoGlass Bottles Market Monitoring Dashboard
Understand the correlation between costs, margins, and prices impacting your category on a real time basis on Beroe LiVE.Ai™
Schedule a DemoGlass Bottles Industry Benchmarks
Savings Achieved
(in %)
The average annual savings achieved in Glass Bottles category is 5.40%
Payment Terms
(in days)
The industry average payment terms in Glass Bottles category for the current quarter is 84.5 days
Compare your category performance against peers and industry benchmarks across 20+ parameters on Beroe LiVE.Ai™
Category Strategy and Flexibility
Engagement Model
Supply Assurance
Sourcing Process
Supplier Type
Pricing Model
Contract Length
SLAs/KPIs
Lead Time
Supplier Diversity
Targeted Savings
Risk Mitigation
Financial Risk
Sanctions
AMEs
Geopolitical Risk
Cost Optimization
Price per Unit Competitiveness
Specification Leanness
Minimum Order Quality
Payment Terms
Inventory Control
The World’s first Digital Market Analyst
Abi, the AI-powered digital assistant brings together data, insights, and intelligence for faster answers to sourcing questions
Abi is now supercharged with GPT4 AI engine. Enjoy the ease of ChatGPT, now on Abi
Use the Glass Bottles market, supplier and price information for category strategy creation and Quaterly Business Reviews (QRBs)
Schedule a DemoGlass Bottles market report transcript
Glass Bottles Global Market Outlook
-
The global glass container market is expected to grow at a CAGR of 4–5 percent during 2023E–2027 (F) and reach approx. 830 billion units by 2027F, driven by increasing consumption of alcoholic and non-alcoholic beverages across markets in the next 1–2 years
-
The pharmaceutical segment is expected to witness a CAGR of 7–8 percent from 2023 to 2027 (F), the highest among other end-use segments, driven by increasing demand for drugs globally and rising consumer awareness toward vaccine and nutraceuticals consumption
-
Suppliers in the West are primarily investing to upgrade plant equipment, in order to achieve higher energy savings and reduce carbon emissions. The emerging markets will experience increasing investments in new furnace installation and refurbishment over the next 2 years
Category Definition: Glass Containers
Glass Container Segmentation by Manufacturing Type :
Molded Glass
-
The molded glass segment produces all types of glass containers used as a primary packaging for packaging beverages, food, cosmetics & pharmaceutical applications
-
Glass containers used for non-injection application are usually made from silica sand, limestone & soda ash
-
High-quality glass packaging for the cosmetics industry, which includes jars and flacons for perfumes and deodorants, skincare, and wellness products
-
Glass containers are widely used in food and beverage industries, owing to its recyclability and chemically inert nature
Tubular Glass
-
Pharmaceutical industries use glass for formulation packaging in the form of ampoules, vials, cartridges, prefilled syringes, etc. With the aging global population, demand for ampoules & vials is currently growing at a significant pace of around 7 percent Y-o-Y
-
Pre-filled syringes are one of the major components of pharma packaging.
Global Imports
-
The US remains the largest importer of glass containers, with Mexico emerging as the preferred sourcing destination, indicating a shift in its trade agreements with China. Overall import value increased by a massive jump of 20 percent in 2021.
Global Exports
-
China remains the largest glass container exporter and Germany serves most of the EU demand. Emerging export countries, like Bulgaria, Turkey, and Czech Republic, indicate a change in trade patterns and preference for regional sourcing low-cost alternatives. Overall exports grew by 2 percent in 2021, due to pandemic-related issues.
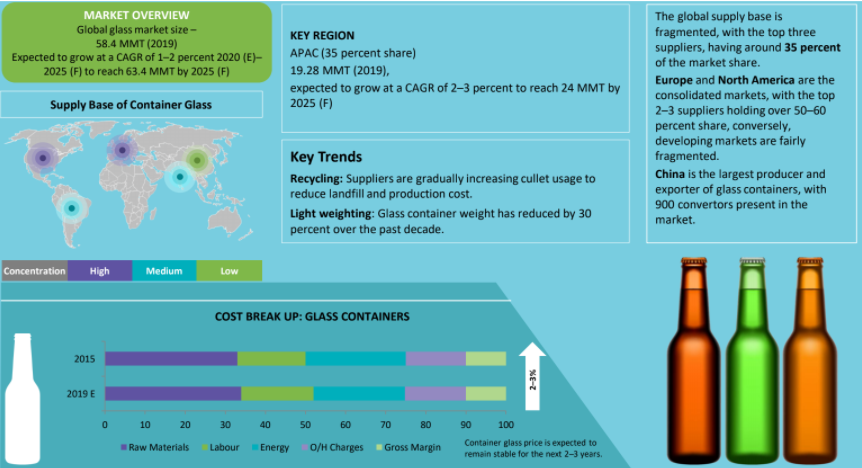
Cost Structure Analysis: Glass Containers
-
The recent sudden price increase in the glass manufacturing industry is directly related to energy cost increases, driven by several factors such as Russia–Ukraine conflict, supply issues for natural gas in Europe and dependency for LNG from US (to replace natural gas supply from Russia), which also impacted cost of other energy resources, such as coke (coal) and electricity.
Manufacturers are trying to overcome this issue via focusing on;
-
Energy saving initiatives, investing in-house energy generation units (solar panels, wind turbines, etc.) and hedging their energy purchases via long term contracts at favorable times.
-
Besides these areas, there are also other initiatives which can be listed as; Consolidating production lines at reduced number of furnaces, to increase the yield per furnace (not to waste any energy for product change overs). Increasing rate of cullets in the process, which requires a certain calculation as the usage of cullets reduce the energy requirement in the process, but the cost of cullets itself is more expensive than the direct raw materials. Manufacturers are working on optimum usage of cullets.
Interesting Reads:
Discover the world of market intelligence and how it can elevate your business strategies.
Learn more about how market intelligence can enable informed decision-making, help identify growth opportunities, manage risks, and shape your business's strategic direction.