CATEGORY
Dairy Derivatives
Oceania is a key market, as it produces only 5 percent of the global milk, but contributes to more than 40 percent of the milk derivatives export market. The strong per capita demand for dairy proteins from vegetarians and infant formula industry are expected to increase the dairy derivatives demand in the coming years.
Beroe LiVE.Ai™
AI-powered self-service platform for all your sourcing decision needs across 1,200+ categories like Dairy Derivatives.
Market Data, Sourcing & Supplier Intelligence, and Price & Cost Benchmarking.
Schedule a DemoThe World’s first Digital Market Analyst
Abi, the AI-powered digital assistant brings together data, insights, and intelligence for faster answers to sourcing questions
Abi is now supercharged with GPT4 AI engine. Enjoy the ease of ChatGPT, now on Abi
Dairy Derivatives Suppliers

Find the right-fit dairy derivatives supplier for your specific business needs and filter by location, industry, category, revenue, certifications, and more on Beroe LiVE.Ai™.
Schedule a Demo

Use the Dairy Derivatives market, supplier and price information for category strategy creation and Quaterly Business Reviews (QRBs)
Schedule a DemoDairy Derivatives market report transcript
Dairy Derivatives Market Analysis and Global Outlook
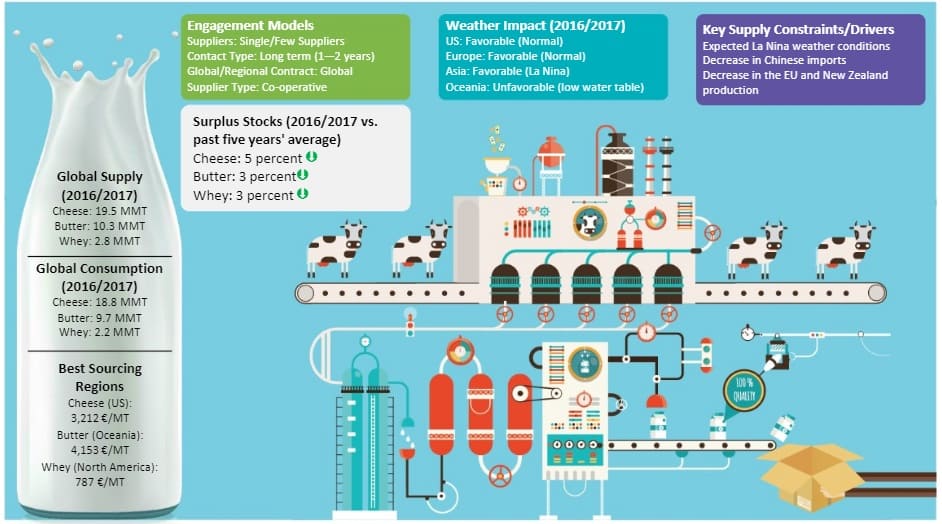
- The global supply–demand dynamics scenario is stabilizing in both milk and dairy derivatives, as the oversupplied condition in the market is lightening. The regional differences and skewed trade dynamics are expected to govern the global price volatility in the near term.
- Oceania is a key market, as it produces only 5 percent of the global milk, but contributes to more than 40 percent of the milk derivatives export market
- With the removal of milk quota system, Europe is expected to increase its production of milk and milk powders until 2018. The high output of dairy products will be directed to export, mainly to Asian countries
- The high output of dairy products will be directed to export, mainly to Asian countries
- The best cost region for Cheese is Europe, for butter is Oceania and for whey is North America
Dairy Derivatives - Value Chain
The market complexity is high, due to standardization and multiple (38) co-products in the value in tier 2 and 3, with majority of the products finding applications in the food & beverage industry. The dairy derivatives (tier 3) products namely the cheese and butter along with whey yield higher profits (15-30 percent) compared to tier 2 products (less than 15 percent)
Cheese and Butter - Value Chain
- 100 liters of whole milk, yields only 1.8kg of butter (80 percent fat) which is a high value product
- 100 liters of whole milk, yields 3.75 liters of cream which in turn yields 10.56 kg cheese with 50 kg of whey as a by product
Whey Value Chain Analysis and Derivatives
- Whey is a by-product of cheese production and hence it forms the raw material for whey powder production
- Various innovations and advances in processing technology of dairy ingredients over a period of time resulted in a number of different finished whey products with varying nutritional profiles
- The production of Whey Protein Concentrate (WPC) and WPI from whey is a value addition, which gives a higher nutritional product that was earlier used as animal feed or just whey. WPI at greater than 90 percent protein, and WPC with protein levels ranging from 34-90 percent are the most functional products of all whey ingredients
Whey Value Addition
- Whey products are experiencing increasing demand in drug and consumer health products. Increasing demand will lead to increased pricing in the upper levels of the whey value chain
- Whey products including whey and lactose derivatives have wide applications. 43 percent of whey and lactose are used in nutrition and pharmaceuticals, 36 percent is used in processed foods like confectionery, meat and bakery and 21 percent is used in feed applications
Milk Derivatives: Industrial Production and Material Flow
Separation is the processing of milk with separators to create skim and cream portions. Separation produces a skim portion that is less than 0.5 percent fat and a cream portion that is usually 40 percent fat. The cream portion is used in the production of butter and cheese, where whey is formed as a by-product of the cheese and casein manufacturing process.
Cheese: Supply–Demand Analysis
- The global cheese landscape is dominated by the top E.U. and U.S. regions, accounting for nearly 80 percent of the production share
- The market is oversupplied by 0.8MMT with production growing at a CAGR of 2.18 percent against consumption at 2 percent
Market Outlook
- Despite the oversupplied market condition, regional differences and lop-sided trade dynamics are expected to govern the global price volatility in the market
- Cheese, globally, is oversupplied by 0.8 MMT, however, less than 10 percent is traded. These factors lead to coherent market dynamics of liquid milk and cheese, as liquid milk is also less traded
- The growing GDP in developing countries and CPI in developing countries are expected to boost the demand for dairy derivatives
Butter: Supply–Demand Analysis
- Butter processing yields a higher margin, of up to 30 percent. The global net supply was around 0.57 MMT (oversupplied) in 2018, in which about 75 percent of the total supply was from India and E.U.
- The global production is growing at a CAGR of 2.86 percent, which is lagging behind the demand growth of 2.96 percent, thus maintaining a steady increase in the international prices
- At a global level, production of butter is increasing at a similar pace to milk, by 2 percent. The capita consumption of butter in developing countries is expected to increase by 1.0 percent/annum on average
Interesting Reads:
Discover the world of market intelligence and how it can elevate your business strategies.
Learn more about how market intelligence can enable informed decision-making, help identify growth opportunities, manage risks, and shape your business's strategic direction.
Get Ahead with AI-Enabled Market Insights Schedule a Demo Now