CATEGORY
Beverage Cans
The report covers Aluminum Beverage Cans. The demand dynamics and trends are covered across 4 regions
Beroe LiVE.Ai™
AI-powered self-service platform for all your sourcing decision needs across 1,200+ categories like Beverage Cans.
Market Data, Sourcing & Supplier Intelligence, and Price & Cost Benchmarking.
Schedule a DemoCategory Alerts
CMI (Can Manufacturers Institute) Beverage can producers endorse the net-zero strategy
April 24, 2023MetalX and Manna Capital to build an aluminum plant in the USA for the packaging industry
April 18, 2023More solar power for Crown?s plants in the US
April 04, 2023Become a Beroe LiVE.Ai™ Subscriber to receive proactive alerts on Beverage Cans
Schedule a DemoBeverage Cans Market Monitoring Dashboard
Understand the correlation between costs, margins, and prices impacting your category on a real time basis on Beroe LiVE.Ai™
Schedule a DemoBeverage Cans Industry Benchmarks
Savings Achieved
(in %)
The average annual savings achieved in Beverage Cans category is 5.40%
Payment Terms
(in days)
The industry average payment terms in Beverage Cans category for the current quarter is 84.5 days
Compare your category performance against peers and industry benchmarks across 20+ parameters on Beroe LiVE.Ai™
Category Strategy and Flexibility
Engagement Model
Supply Assurance
Sourcing Process
Supplier Type
Pricing Model
Contract Length
SLAs/KPIs
Lead Time
Supplier Diversity
Targeted Savings
Risk Mitigation
Financial Risk
Sanctions
AMEs
Geopolitical Risk
Cost Optimization
Price per Unit Competitiveness
Specification Leanness
Minimum Order Quality
Payment Terms
Inventory Control
The World’s first Digital Market Analyst
Abi, the AI-powered digital assistant brings together data, insights, and intelligence for faster answers to sourcing questions
Abi is now supercharged with GPT4 AI engine. Enjoy the ease of ChatGPT, now on Abi
Use the Beverage Cans market, supplier and price information for category strategy creation and Quaterly Business Reviews (QRBs)
Schedule a DemoBeverage Cans market frequently asked questions
As per Beroe's analysis, the beverage market is expected to grow at 3-4 percent CAGR by 2021 and will likely reach 405 billion units. The growth is driven by the increasing consumption of CSD and beer in developing markets like China, the Middle East, and India. Though regions like NA and EU are low at CSD consumption, it gets compensated by the increased consumption in the emerging markets.
As per the beverage can market analysis report by Beroe, the specialty cans (slim) are expected to grow by 8'10 percent over the next 5 years. The leading factors involve increased penetration in energy drinks, premium water, juices, RTD, beverages, etc.
Asia is the highest growth region for beverage cans and is expected to grow from 119 billion (30-percent) to 155 billion by 2023 at a growth rate of 5-6 percent CAGR. The top three suppliers hold nearly 60 percent of the beverage can market share.
As per Beroe's report, Ball Corporation with a 31% share, Crown Holdings with 18%, Ardagh Group with 9% share, and Can-Pack with 4% market share are the top global suppliers of beverage cans.
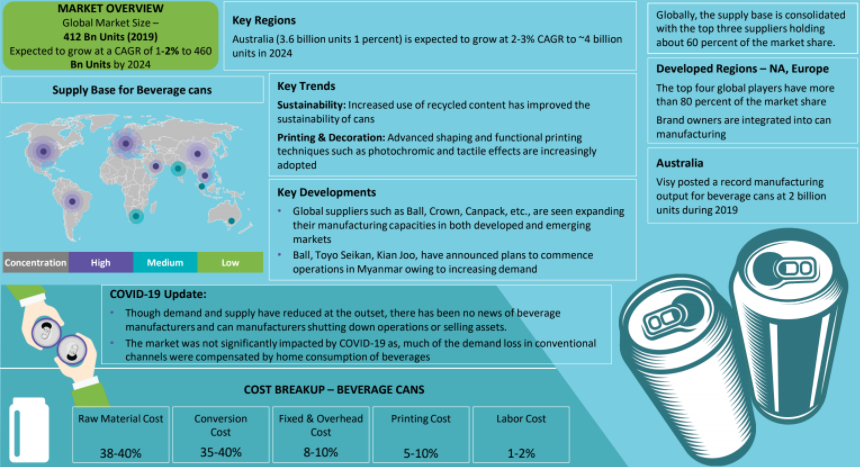
As per Beroe's report, the cost breakup of the aluminum can market includes the following: - Raw materials cost = 38 ' 40% - Conversion Cost = 35 ' 40% - Fixed or overhead cost = 8 ' 10% - Printing cost = 5 ' 10% - Labor cost = 1 ' 2%
Two primary factors that contributed to the expansion of manufacturing facilities in countries like Myanmar, Thailand, UAE, Cambodia, India, etc. are: Maturing consumption of beer and CSD in the developed markets Considerable increase in the consumption within the developing/emerging markets
As per Beroe's analysis report, the average beverage cans market size is projected to show a growth rate of 3 ' 4% CAGR by 2023 given the increased demand for beer and CSD in developing regions.
According to the global beverage cans analysis report by Beroe, the increased demand is due to: Increased penetration of metal cans in different segments like RTD beverages, water, wines, etc. The increasing consumption of beverage cans in developing markets of regions like Asia and the LATAM that are expected to grow at a CAGR of 4 ' 5% and 3 ' 4% respectively by 2023.
As per the beverage cans market report by Beroe., North America (NA) holds the maximum shares (nearly 35%) in the beverages market with a high per capita consumption of 315 cans per year and 2 ' 3 percent CAGR.
The most common beverage cans trends include: - Change of lifestyle and inclination towards on-the-go food and drinks - Decline in the CSD segment, especially in the developed regions of NA and EU. - The use of plastics for CSD and its inclusion into beer packaging will impact the demand for metal cans.
Beverage Cans market report transcript
Global Market Outlook on Beverage Cans
-
The global beverage can market is expected to grow at 3–4 percent CAGR during 2023E–2027F, to reach ~511 billion units, driven by rising consumption of beverages and change in consumer purchasing behavior
-
The global market is expected to witness substantial growth owing to the increasing recycling of used beverage cans. The growing demand for optimum utilization of natural resources has driven the demand for the recycling of aluminum cans for reuse
Regional Demand Overview
-
Rapid expansion activities are helmed by global suppliers, like Ball, Crown, Ardagh, Canpack, CPMC, Baosteel, etc. This supplier trend indicates a rise in demand for beverage products in aluminum cans across the globe
Global Market Size: Metal Beverage Cans
-
The global beverage can market is estimated to be ~438 billion units in 2023E and is expected to grow at the rate of ~3–4 percent CAGR (2023E–2027F)
-
A change in consumer consumption patterns may introduce new product segments, like craft beer, ciders, sparkling water, etc., to adopt cans. Demand is expected to be driven by specialty can segments, such as slim and sleek
- Demand for beverage cans would be driven by the increasing consumption in markets, like the US and Asia, which are expected to grow at CAGR 4–5 percent and 5–6 percent, respectively, during 2023E–2027F. The downstream demand would be driven by beer (4–6 percent), CSD (3–4 percent), and health drinks (6–8 percent)
-
NA has the largest market share for beverage cans but concerns of supply constraint and demand management have impacted growth of beverage cans. Meanwhile, Asia-Pacific led by countries, like China, India, Vietnam, and other South-East Asian countries, are expected to lead growth in demand for beverage cans.
-
Suppliers are expanding in these territories and ensuring safety of supply and regional dominance over global suppliers
-
Growing consumer consciousness toward sustainability and reusability is expected to drive innovations, such as reusable cans with re-sealable closures, and penetration of cans in segments, like water, RTD beverages, introducing self-chilling/heating cans into the market
Global Beverage Cans Analysis
Global Beverage Cans Market Demand
Growing at home consumption of beer and health beverages has increased the demand for aluminum beverage cans globally. Omnichannel selling has shifted preference from glass bottles to aluminum cans, owing to stability, less product damage/breakage during transit, along with improved functionality and aesthetic appeal
Downstream Demand Outlook
The global beverage cans market size was estimated at USD 26.5 billion in 2023E and to reach USD 32.9 billion by 2027F, at a (CAGR) of 5.6%
Globally, beer and CSD categories account for most of the consumption of beverage cans, with a CAGR of 4–6% and 3–4%, respectively.
Specialty cans (slim cans) are expected to have higher demand than standard cans and grow at a CAGR of 6–7%, during 2023E–2027F. These cans are increasingly used in still drinks, sparkling water, RTD beverages, FABs, etc., which would grow at 5–6% CAGR
The rapid development of organized retailing and the changing consumption patterns in the developing regions, such as Southeast Asia and MEA, would also foster the demand for beverage cans.
Beverage cans are expected to gain the highest penetration rates in the beer, seltzers, and non-alcoholic soft drink segment over the 1–2 years.
Global Beverage Can Demand by Region
-
The demand for beverage cans is expected to grow the highest in Asia and NA at 4–6 percent CAGR during 2023E–2027F. Global converters are seen expanding their capacities in Asia and the US
-
Rising consumer consumption of alcoholic and non-alcoholic beverages across countries is expected to boost demand for beverage cans globally.
Global Trade Dynamics
-
Globally, beverage cans trade was at a surplus of $22 million during 2021. Countries, like Canada, the US, and Belgium led the deficit with over $700 million in total, whereas countries, like Mexico, China, and Germany, had trade surpluses of over $800 million during the respective period
-
Much of the trade for beverage cans happens regionally with suppliers, increasing capacity and expanding strategically through acquisitions over the past 12 months
Global Imports
-
Global imports increased by ~10 percent during 2020–2021. Majority of the import activities were concentrated to reduce reliance on Chinese commodities, this helped few economies develop, like Mexico and the US, where trade activities flourished.
-
Cost of transportation, supply tightness, leading to restricted movement of goods, economic impact of the pandemic were contributing factors for the value increase of imports globally
Global Exports
-
Global exports increased by ~12 percent during 2020–2021. Exports increased two-fold from Mexico with majority of its products reaching the US. Trade restrictions, duties against Chinese imports have made Mexico the favored near-shore destination for beverage cans
-
Globally, exports were region-specific, indicating a shift in purchasing behavior and movement of goods in the future to a more regional set-up. This is also possible, due to protectionist economic policies, restricting unfair trade practices
Regional Market Snapshot
The regional market information section has vital information on the regional beverage can markets. The market share, estimated market supply, growth rate as well as the market maturity details give a snapshot of the regional beverage can markets. It also gives detailed supply-demand trends and outlook for each region. The trade dynamics of each region is also described with details of the export and import share by country.
Market Overview : Aluminum (NA)
Growing supply pressure and weak demand
-
COMEX aluminium have gained 4.1 percent to average at $2,535/MT in January 2023.
-
Aluminium prices rose at the beginning of January. While it is true that China raising aluminum export taxes could have impacted aluminum prices.
-
Moreover, scrap Aluminum supplies remain low due to ongoing aluminum can shortages in the US, mills continue to face problems finding UBCs (used beverage cans) many businesses that rely on aluminum cans (like breweries and soda producers like Coca-Cola) faced massive problems with getting enough aluminum cans to meet demand
Manufacturing Process –Beverage Can
The report explains the different processes that are followed in the manufacture of different types of beverage cans.
Value Chain Analysis –Beverage Cans
The value chain of a beverage can manufacturer has a different cost impact at each step in the chain. The balance of power also varies at each stage in the value chain and the report gives details of the same.
Global Market Size –Metal Beverage Cans
The global beverage can market size and the growth rate is detailed in this section. It also states the global market demand for beverage cans as well as the share of the aluminum beverage can market vs cans made of other materials.
Industry Analysis
This section analyses the different aspects of the beverage can industry and gives valuable information as well as facts and figures pertaining to the different aspects of the industry.
Industry Drivers and Constraints
The report gives a concise report of the main factors that are the drivers and constraints of the beverage can industry. It examines downstream sustainability and demand. It also explains the challenges posed by Supply Base Consolidation and other products that are being used to substitute beverage cans.
Market Trends And Innovations
The latest beverage cans trends in the market are detailed in this section. The constantly evolving applications and technology used in beverage manufacturing have led to many innovations in the industry. The report describes these innovations, their benefits as well as the companies that are credited for the new ideas.
Why You Should Buy This Report
● Global and regional market overview, demand-supply analysis, Porter’s five force analysis and market trends in the aluminum cans industry.
● Innovations and key beverage cans suppliers in the regional and global market and does a SWOT analysis.
● Cost break-up and cost model for aluminum cans market.
Interesting Reads:
Discover the world of market intelligence and how it can elevate your business strategies.
Learn more about how market intelligence can enable informed decision-making, help identify growth opportunities, manage risks, and shape your business's strategic direction.