CATEGORY
Wastewater Treatment
Beroe LiVE.Ai™
AI-powered self-service platform for all your sourcing decision needs across 1,200+ categories like Wastewater Treatment.
Market Data, Sourcing & Supplier Intelligence, and Price & Cost Benchmarking.
Schedule a DemoWastewater Treatment Industry Benchmarks
Savings Achieved
(in %)
The average annual savings achieved in Wastewater Treatment category is 9.86%
Payment Terms
(in days)
The industry average payment terms in Wastewater Treatment category for the current quarter is 52.6 days
Compare your category performance against peers and industry benchmarks across 20+ parameters on Beroe LiVE.Ai™
Category Strategy and Flexibility
Engagement Model
Supply Assurance
Sourcing Process
Supplier Type
Pricing Model
Contract Length
SLAs/KPIs
Lead Time
Supplier Diversity
Targeted Savings
Risk Mitigation
Financial Risk
Sanctions
AMEs
Geopolitical Risk
Cost Optimization
Price per Unit Competitiveness
Specification Leanness
Minimum Order Quality
Payment Terms
Inventory Control
The World’s first Digital Market Analyst
Abi, the AI-powered digital assistant brings together data, insights, and intelligence for faster answers to sourcing questions
Abi is now supercharged with GPT4 AI engine. Enjoy the ease of ChatGPT, now on Abi
Wastewater Treatment Suppliers
Find the right-fit wastewater treatment supplier for your specific business needs and filter by location, industry, category, revenue, certifications, and more on Beroe LiVE.Ai™.
Schedule a Demo

Use the Wastewater Treatment market, supplier and price information for category strategy creation and Quaterly Business Reviews (QRBs)
Schedule a DemoWastewater Treatment market report transcript
Global Treated Water Systems Market Overview
-
The global water treatment market was around $409.78 billion in 2023 by putting together utilities, solutions, and services
-
Wastewater treatment equipment market size was around $70.63 billion in 2023
-
Though the maturity of APAC is not significant due to lack of awareness and strict government regulations, the growth is anticipated to be majorly from the region due to over population, water scarcity and increasing industrial activity
-
The US water treatment market is expected grow significantly due to stringent water regulations and increasing recycle/re-usage trend
-
End-user industries like food and beverage, power, electronics, and semiconductor, the services are outsourced to major global suppliers and the suppliers are engaged on a long-term basis
-
To monitor and record the spread of the infection, researchers are weighing wastewater to identify the intensity of the virus in the local outbreak
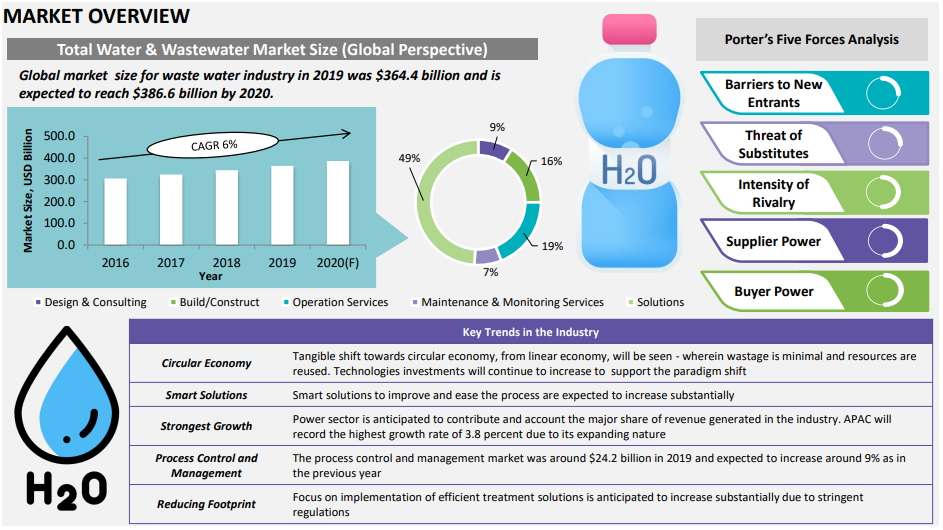
Global Treated Water System - Market Maturity
-
Integrated water management system are gaining more significance in most of the buyers for operational sustainability
-
North American and European markets accounts for almost 50 percent of the total market size in global treated water industry
Global Waste Water Drivers and Constraints
-
Despite high physical capital in the wastewater treatment plants, developed countries in North America, Europe and countries in Asia will create higher demand and implements advanced technologies.
-
High environmental awareness combined with desire for reusable and recycling technology is driving the treated water system technology and its related market.
Drivers
Economic Development
-
Recycle and Reuse contributes a major proposition across the industries, which in turn reduces the dependencies of physical resources from other regions. This factor of self-sustainability accounts to the reduction of physical capital and contributes to the economic development.
Environmental Awareness
-
Shredding, Sorting and Separation are the challenging process across the life-cycle in wastewater treatment and thus need appropriate number of Human Resources. Environment awareness and strict policies will result in the reduction of cost and supports the environment from getting polluted.
Necessity for Recycling of Wastewater and Desire for Purified Water
-
Rapid Industrialization and increased production outputs will encompass the necessity of recycling of wastes. Self-sustaining industries which are highly capable in reduced operating cost along with zero-residual creates a desire in getting purified water as a final product.
Constraints
-
Economic Downturn
-
High Metal Price
-
High Investment
-
Stringent Regulation
-
Weak Demand from Semi conductor industry
Interesting Reads:
Discover the world of market intelligence and how it can elevate your business strategies.
Learn more about how market intelligence can enable informed decision-making, help identify growth opportunities, manage risks, and shape your business's strategic direction.
Get Ahead with AI-Enabled Market Insights Schedule a Demo Now