CATEGORY
Waste Management Australia
Waste management category covers mostly the industrial waste which can be hazardous and non-hazardous in nature.
Beroe LiVE.Ai™
AI-powered self-service platform for all your sourcing decision needs across 1,200+ categories like Waste Management Australia.
Market Data, Sourcing & Supplier Intelligence, and Price & Cost Benchmarking.
Schedule a DemoThe World’s first Digital Market Analyst
Abi, the AI-powered digital assistant brings together data, insights, and intelligence for faster answers to sourcing questions
Abi is now supercharged with GPT4 AI engine. Enjoy the ease of ChatGPT, now on Abi
Waste Management Australia Suppliers
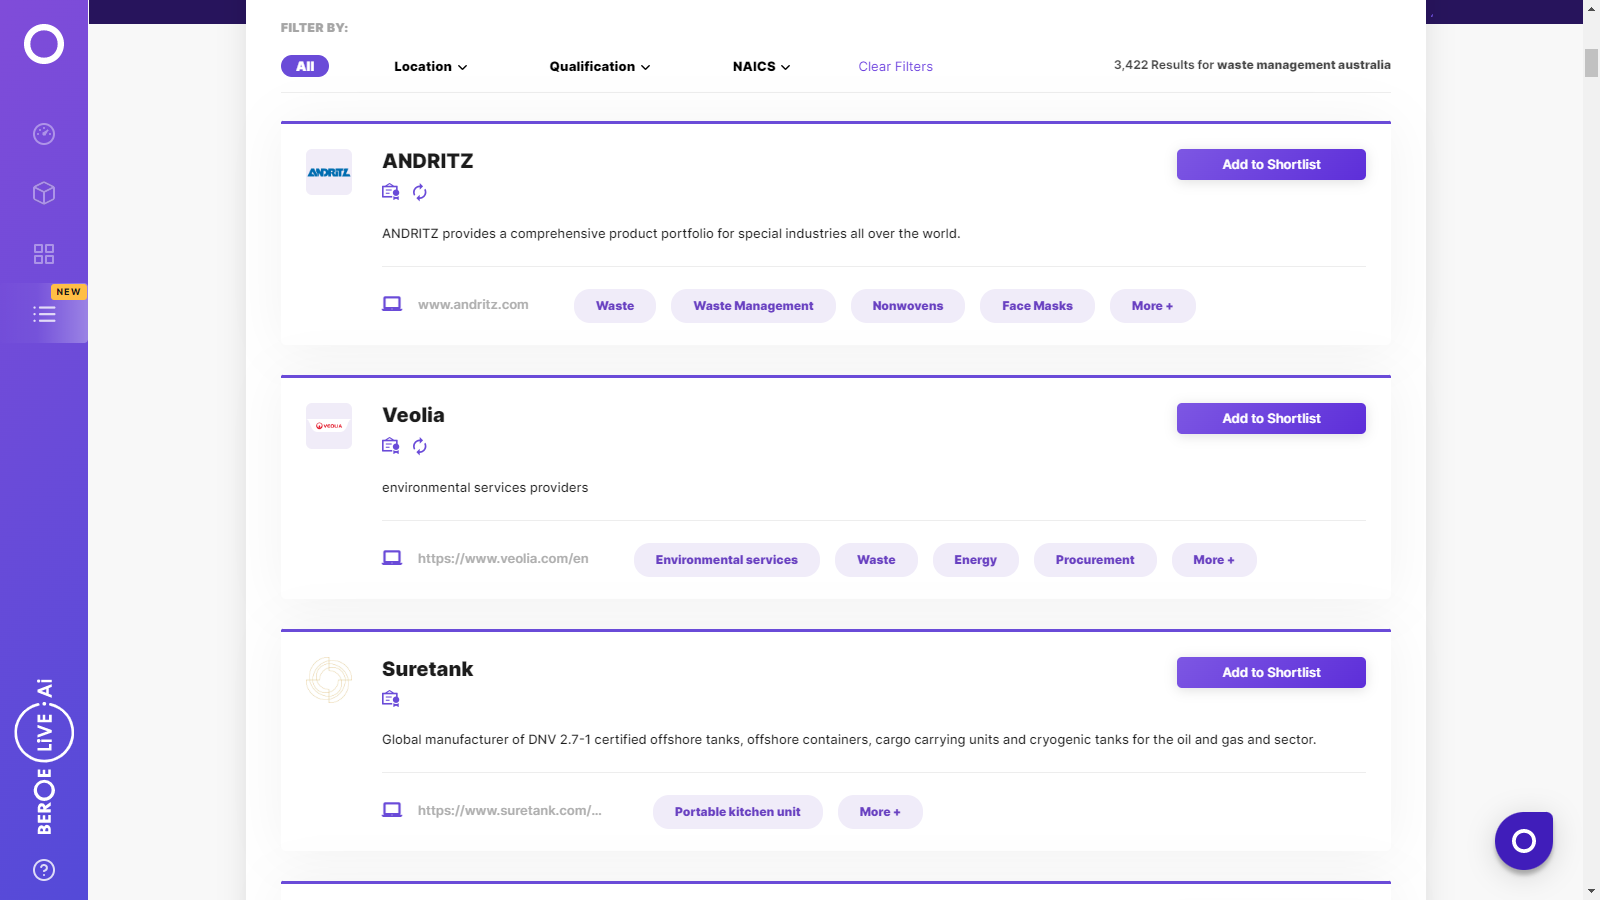
Find the right-fit waste management australia supplier for your specific business needs and filter by location, industry, category, revenue, certifications, and more on Beroe LiVE.Ai™.
Schedule a Demo

Use the Waste Management Australia market, supplier and price information for category strategy creation and Quaterly Business Reviews (QRBs)
Schedule a DemoWaste Management Australia market report transcript
Regional Market Outlook On Waste Management
Waste streams in Australia are comprised of municipal waste and commercial waste among which paper, plastics, and metals are the major categories.
- Municipal waste data are for all states and territories, except South Australia, the Northern Territory and Tasmania. Commercial and industrial waste data were sourced from New South Wales, Victoria, and South Australia.
- New South Wales data include some recyclable materials (paper, plastics, glass, etc.), classified under the category ‘other recyclables'. New South Wales data on metals exclude non-ferrous metals, such as aluminum
- Construction and demolition waste data are for New South Wales, Victoria and South Australia only
- In the recent years, recycling rates have increased at a faster rate than disposal to landfill. Despite this growth, more solid waste is disposed to landfill (54 per cent) than is recycled (46 per cent). However, this varies markedly between materials
- The export of recyclable material has increased in the recent years, mostly driven by increased demand from Asia
- State Government Budget in 2017 announced a staged increase of the levy to AU$103 per tonne by 2019–2020 in metropolitan Adelaide
Porter's Five Forces Analysis: Waste Management Services (Australia)
- Large buyers have strong buyer power, due to a large consolidated business volume
- Suppliers are trying to improve their supply capabilities to offer a holistic service portfolio, and thereby gain some negotiation power
Barriers to New Entrants
- Entry barriers to the waste industry is high due to high capital costs related to truck and equipment expenses. These vehicles tend to be custom-made and need to be purchased, rather than rented or leased.
- Larger companies with extensive waste collection services are able to optimise vehicle usage, which can also lead to cost savings and lower tendering prices, making it difficult for new, smaller entrants to compete for contracts on the basis of price.
Buyer Power
With the advent of complex, integrated outsourcing categories, buyers will yield higher power, due to the volume of waste generated, especially in Australia
Threat of Substitutes
- Most of the global players posses required license and have adopted various advanced waste treatment methods for improved service delivery
- Government legislation and EPA fees can limit new operators from entering the industry
Intensity of Rivalry
- The industry is in the growth phase and has a significant future growth, so there will be considerable competition among major service providers
- Heavy competition prevails across Western Australia, New South Wales and Victoria regions
Supplier Power
- Due to the emergence of a integrated business model, service providers are likely to enjoy significant leverage
- Buyers can strictly monitor pass-through costs to ensure no markups and deny payment of profits to service providers, in case of non-compliance of KPIs
Innovative Smart Technology for Waste Management
Innovative technologies in waste management save lot of money for companies, as well for countries and help them to reduce carbon footprints.
Waste Data Analysis
- Smart technologies help officials to better analyze and manage their waste
- An example is IBM Research, which partnered with the Nairobi City County
- Using big data, analytics and mobile technology to develop a programs for different waste management processes, so that they can collect data about the fleet, trucks and drivers, while also tracking problems on the roadways
Solar Powered Trash Compactors
- By compressing its contents, the unit gains capacity, so it does not have to be emptied as often
- Fewer collections mean cost-savings for labor, fuel and maintenance and reduced greenhouse gas emissions
- Powered by the sun, eco-friendly compactors work in every kind of weather — snow, rain or shine
- An example is City of Richmond in Virginia, City of New Orleans in Louisiana
Robot Technology
- Use suction pads to lift and sort household, municipal waste, such as cans and bottles
- Each robot is estimated to have a picking cycle of one pick every three seconds, or 20 picks per minute. This equates to 1.8 million picks per year, or up to 200 tons of material
Smart Bins & Internet of Things
- Equipped with wireless notification system and is connected to a computer or smartphone in real-time, which automatically alerts the facility's Waste Manager when the trash bin or baler is approaching full, so that trash related tasks can be completed on demand
- In cases where the frequency of waste generation is variable or slower, the wireless monitoring will save time, eliminate unnecessary work, and ultimately, save labor costs
- It is currently been practiced in developed countries, but still not on a larger scale
Interesting Reads:
Discover the world of market intelligence and how it can elevate your business strategies.
Learn more about how market intelligence can enable informed decision-making, help identify growth opportunities, manage risks, and shape your business's strategic direction.
Get Ahead with AI-Enabled Market Insights Schedule a Demo Now