CATEGORY
Uniform Services
Beroe LiVE.Ai™
AI-powered self-service platform for all your sourcing decision needs across 1,200+ categories like Uniform Services.
Market Data, Sourcing & Supplier Intelligence, and Price & Cost Benchmarking.
Schedule a DemoUniform Services Industry Benchmarks
Savings Achieved
(in %)
The average annual savings achieved in Uniform Services category is 9.00%
Payment Terms
(in days)
The industry average payment terms in Uniform Services category for the current quarter is 30.0 days
Compare your category performance against peers and industry benchmarks across 20+ parameters on Beroe LiVE.Ai™
Category Strategy and Flexibility
Engagement Model
Supply Assurance
Sourcing Process
Supplier Type
Pricing Model
Contract Length
SLAs/KPIs
Lead Time
Supplier Diversity
Targeted Savings
Risk Mitigation
Financial Risk
Sanctions
AMEs
Geopolitical Risk
Cost Optimization
Price per Unit Competitiveness
Specification Leanness
Minimum Order Quality
Payment Terms
Inventory Control
The World’s first Digital Market Analyst
Abi, the AI-powered digital assistant brings together data, insights, and intelligence for faster answers to sourcing questions
Abi is now supercharged with GPT4 AI engine. Enjoy the ease of ChatGPT, now on Abi
Uniform Services Suppliers

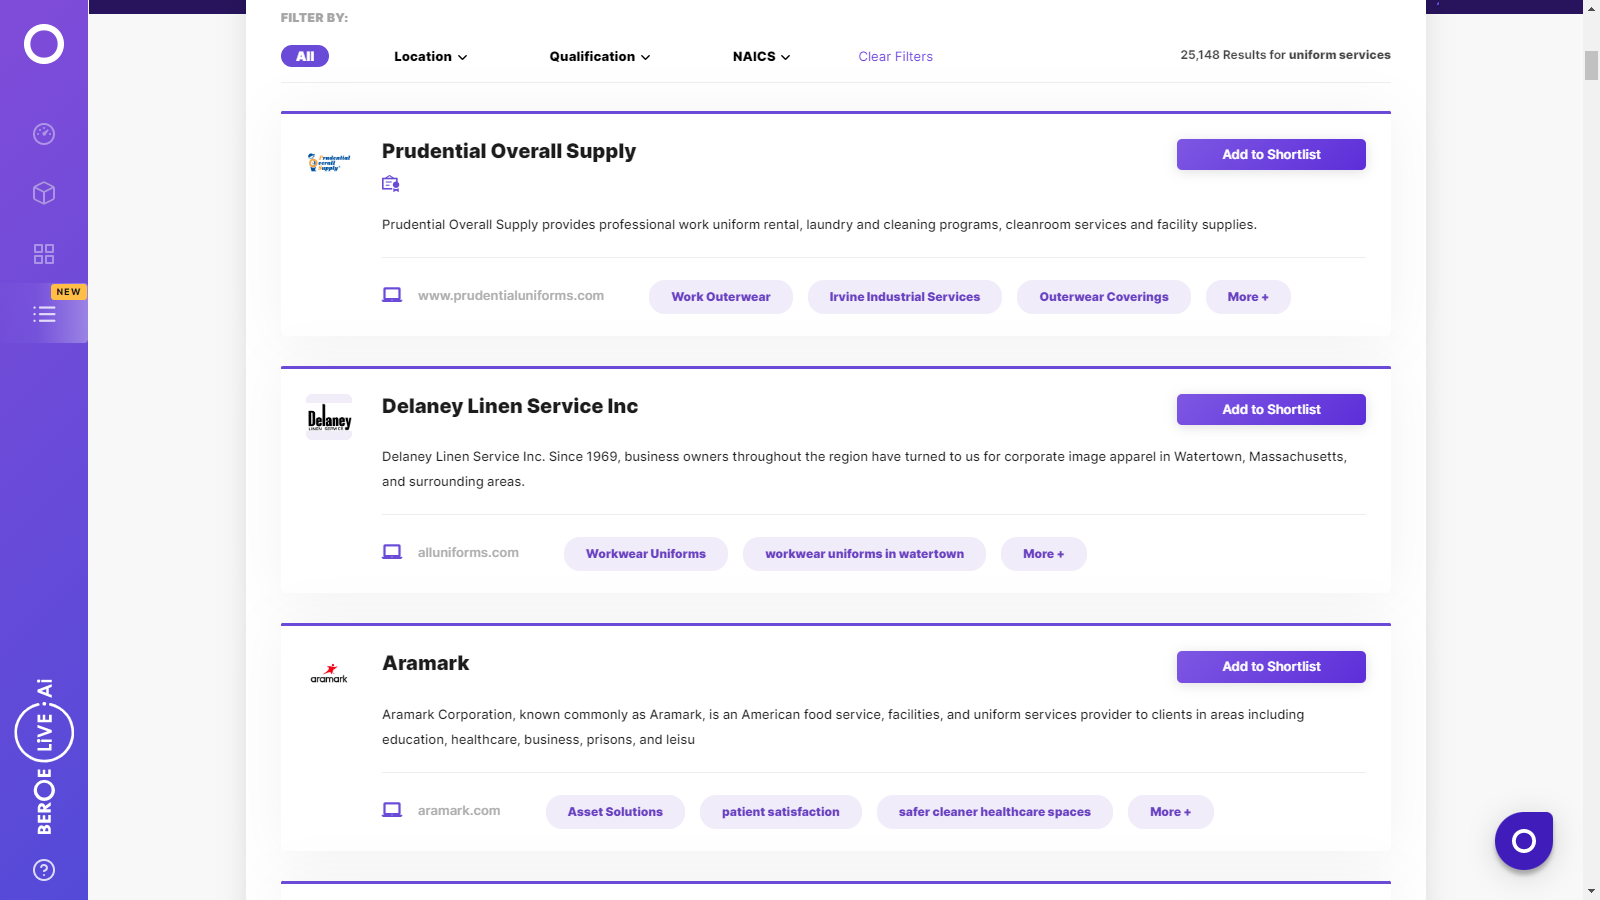
Find the right-fit uniform services supplier for your specific business needs and filter by location, industry, category, revenue, certifications, and more on Beroe LiVE.Ai™.
Schedule a Demo


Use the Uniform Services market, supplier and price information for category strategy creation and Quaterly Business Reviews (QRBs)
Schedule a DemoUniform Services market report transcript
Uniform Services Global Market Outlook
-
The global uniform service industry was valued at $37.29 billion in 2022, the market is forecasted to grow at a CAGR of 4–6 percent by 2025
-
Emerging regions, including the US & APAC market, are highly matured, in terms of the buyer as well as supplier maturity
Global Uniform Services Market: Drivers and Constraints
Uniform services experienced improving trends, particularly in the rental business as well as increased client demand for adjacency services, including Personal Protective Equipment (PPE)
Industry Drivers
Demand for Material Innovation
-
Increase in demand for continuous research and developments in the innovation of advanced fabric and materials
-
Demand for fashionable, user friendly & Functional unforms such as night visibility uniform products.
-
Use of technology (IoT, physical distance platforms) enabled uniforms
Growing Supply of Workforce
-
Safety of employees is the major market demand from organizations and increase in the workforce can impact the uniform service industry positively
Growing Demand from Business Sector
-
Organizations are adopting advanced uniform products for their employees
Constraints
Substitutes
-
Alternatives (use of robots) and operational strategies (remote working) are affecting the uniform service market
Competitive Landscape
-
Lot of key global players and other local service providers are competing in the market which forms a competitive landscape for this category
Price Model and Contract Type : Uniform Services
-
Distributors procure workwear products in large quantities. Hence, they have higher bargaining power and leverage economies of scale
-
The distributors occupy a major market for workwear, as manufacturers and buyers depend on them for their strong and extensive network centers
-
Currency fluctuations have a great impact on the final price of Workwear products
-
Price increase is expected, due to supply disruptions and product shortage, due to close down of manufacturing plants due to COVID
Contract Type
-
There is no standard contract while engaging with a distributor
-
The pricing are based on catalogs, the actual contract length and discount policies depend on the customer, products acquired and quantity purchased. However global companies tend to sign short to medium term contracts (annual or maximum 2-3 years contracts)
-
These contracts stipulate periodical purchases of products and/or services, in order to secure stock availability, and freeze prices for the contract period
Interesting Reads:
Discover the world of market intelligence and how it can elevate your business strategies.
Learn more about how market intelligence can enable informed decision-making, help identify growth opportunities, manage risks, and shape your business's strategic direction.
Get Ahead with AI-Enabled Market Insights Schedule a Demo Now
