CATEGORY
Civil Construction Industry Australia
Beroe LiVE.Ai™
AI-powered self-service platform for all your sourcing decision needs across 1,200+ categories like Civil Construction Industry Australia.
Market Data, Sourcing & Supplier Intelligence, and Price & Cost Benchmarking.
Schedule a DemoThe World’s first Digital Market Analyst
Abi, the AI-powered digital assistant brings together data, insights, and intelligence for faster answers to sourcing questions
Abi is now supercharged with GPT4 AI engine. Enjoy the ease of ChatGPT, now on Abi
Civil Construction Industry Australia Suppliers
Find the right-fit civil construction industry australia supplier for your specific business needs and filter by location, industry, category, revenue, certifications, and more on Beroe LiVE.Ai™.
Schedule a Demo

Use the Civil Construction Industry Australia market, supplier and price information for category strategy creation and Quaterly Business Reviews (QRBs)
Schedule a DemoCivil Construction Industry Australia market report transcript
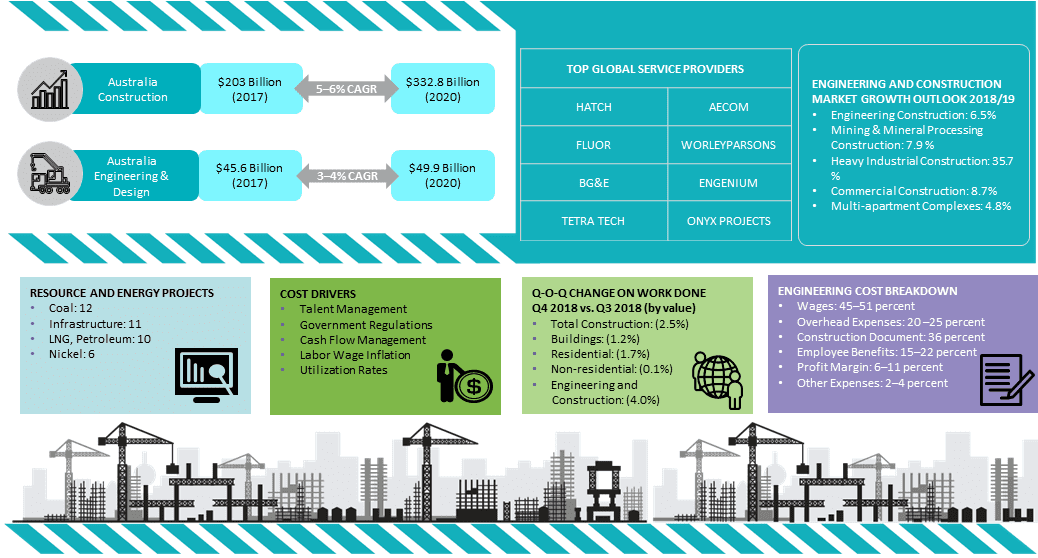
Regional Market Outlook on Engineering and Construction Industry
-
The APAC region has the major share with approximately 40 percent, followed by Europe and North America. Countries, like the US, India, are planning to invest a lot for infrastructure development. The US government has allocated $1 trillion for development
-
APAC : The largest shareholder of construction industry is expected to reach up to $6.1 trillion with a CAGR of 4 -5 percent
Regional Outlook Civil Construction Industry Australia
APAC
Dominating Regions - China, India, Indonesia, Australia
Drivers
-
The Indian government has increased the share for the budget on infrastructure to improve the road connectivity
-
The growing population demands the increase in residential construction
Constraints
-
Volatile price nature of oil impacts the production and transportation of construction materials
Global Construction: Industry Overview
APAC is the largest shareholder with 40 percent of the market size followed by Europe and North America with 26 percent and 22 percent respectively.
Developing Regions:
APAC: The highest contribution in the global construction industry. China and India are the main players in this region. India has extended their budget for infrastructure in their latest financial budget. China is investing a lot for its infrastructure development
Market Size: APAC
Outlook:
-
The construction market in the APAC is expected to reach up to $ 6.15 trillion in 2022 and $6.71 trillion in 202e with a CAGR of 4–5 percent. After the relaxation of lockdown condition the APAC market is growing in a higher rate when compared to other regions globally.
-
APAC has the highest share with approximately 40 percent in the global construction industry.
-
China and India contributes a large share for the construction industry with huge investments of various sectors.
-
The Indian engineering and construction industry is expected to double in size by 2022, driven by Foreign Direct Investment (FDI)
-
The spend for construction in residential sector is more in APAC as the population growth rate is high which increases the demand for residential buildings.
-
The Indian and Chinese governments are having projects for their infrastructural developments with huge investments.
Procurement Centric Five Forces Analysis: Developed markets
(NA, Parts of Europe & APAC)
The construction industry in Australia is in the growth phase with large-scale projects are being announced at resource and infrastructure sector. Even though the market has several highly capable suppliers, there will be pressure on the buyers for choosing the best suitable supplier. This scenario will result in higher margins for suppliers and lower bargaining power for buyers.
Supplier Power
-
A majority of the construction firms have a large portfolio, cutting across a wide range of construction and related services across diverse industry segments. This helps them in negating overdependence on any particular sector
-
The dipping order backlogs have put further pressure on them to attract more projects into their account
Barriers to New Entrants
-
The presence of a large number of service providers, clubbed with the weak outlook for the industry, deters prospective service providers from entering the marketplace
-
The regulatory standards for construction activities and the reduced profit margins further reduce the overall attractiveness of the region
Intensity of Rivalry
-
Large global and regional firms have international presence along with medium and smaller local firms
-
Prevailing economic conditions and limited construction activities in the region have increased the competition amongst the suppliers, mainly on the pricing
Threat of Substitutes
-
Rentals for office and commercial space
-
Prefabricated/Modular construction
-
Increase in the number of capable engineering design firms in developing nations like India provides opportunities to outsource basic designing works
Buyer Power
-
Uncertainty over industry growth and rising construction cost
-
The buyer has better negotiating power in the current economic situation, due to the availability of a large number of capable suppliers, who offer almost all required services
Engineering Consultancy Firm: Cost Structure
- Cost structure for Engineering Consultancy (EC) firms is higher in Australia, as employee benefits and allowances are higher
- Profit margins * vary depending on supply/demand and market structure. As the Australian mining sector is recovering with an inflow of new investments, the profit margins will be higher for top contractors
- Labor costs (contributing to approx. 50 percent of total costs) can be minimized by sourcing commoditized services with local suppliers
- Overheads can be negotiated based on experience and size of the firm:
- Highly leveraged firms typically have high overhead costs
- Low utilization rates will be passed onto the client in the form of overheads
- Travel expenses can be minimized by outsourcing to remote locations or by sourcing locally, depending on cost vs. quality benefits
Interesting Reads:
Discover the world of market intelligence and how it can elevate your business strategies.
Learn more about how market intelligence can enable informed decision-making, help identify growth opportunities, manage risks, and shape your business's strategic direction.
Get Ahead with AI-Enabled Market Insights Schedule a Demo Now