CATEGORY
Energy As A Service
Beroe LiVE.Ai™
AI-powered self-service platform for all your sourcing decision needs across 1,200+ categories like Energy As A Service.
Market Data, Sourcing & Supplier Intelligence, and Price & Cost Benchmarking.
Schedule a DemoCategory Alerts
Magna & Yulu joins to provide 'Battery as a Service' offering
February 07, 2023African Energy-as-a-Service company, Solarise Africa, Secures $33.4m
November 29, 2022Telefonica plans towards net zero status by 2040 through energy efficiency
November 15, 2022Become a Beroe LiVE.Ai™ Subscriber to receive proactive alerts on Energy As A Service
Schedule a DemoEnergy As A Service Industry Benchmarks
Savings Achieved
(in %)
The average annual savings achieved in Energy As A Service category is 8.10%
Payment Terms
(in days)
The industry average payment terms in Energy As A Service category for the current quarter is 37.5 days
Compare your category performance against peers and industry benchmarks across 20+ parameters on Beroe LiVE.Ai™
Category Strategy and Flexibility
Engagement Model
Supply Assurance
Sourcing Process
Supplier Type
Pricing Model
Contract Length
SLAs/KPIs
Lead Time
Supplier Diversity
Targeted Savings
Risk Mitigation
Financial Risk
Sanctions
AMEs
Geopolitical Risk
Cost Optimization
Price per Unit Competitiveness
Specification Leanness
Minimum Order Quality
Payment Terms
Inventory Control
The World’s first Digital Market Analyst
Abi, the AI-powered digital assistant brings together data, insights, and intelligence for faster answers to sourcing questions
Abi is now supercharged with GPT4 AI engine. Enjoy the ease of ChatGPT, now on Abi
Energy As A Service Suppliers
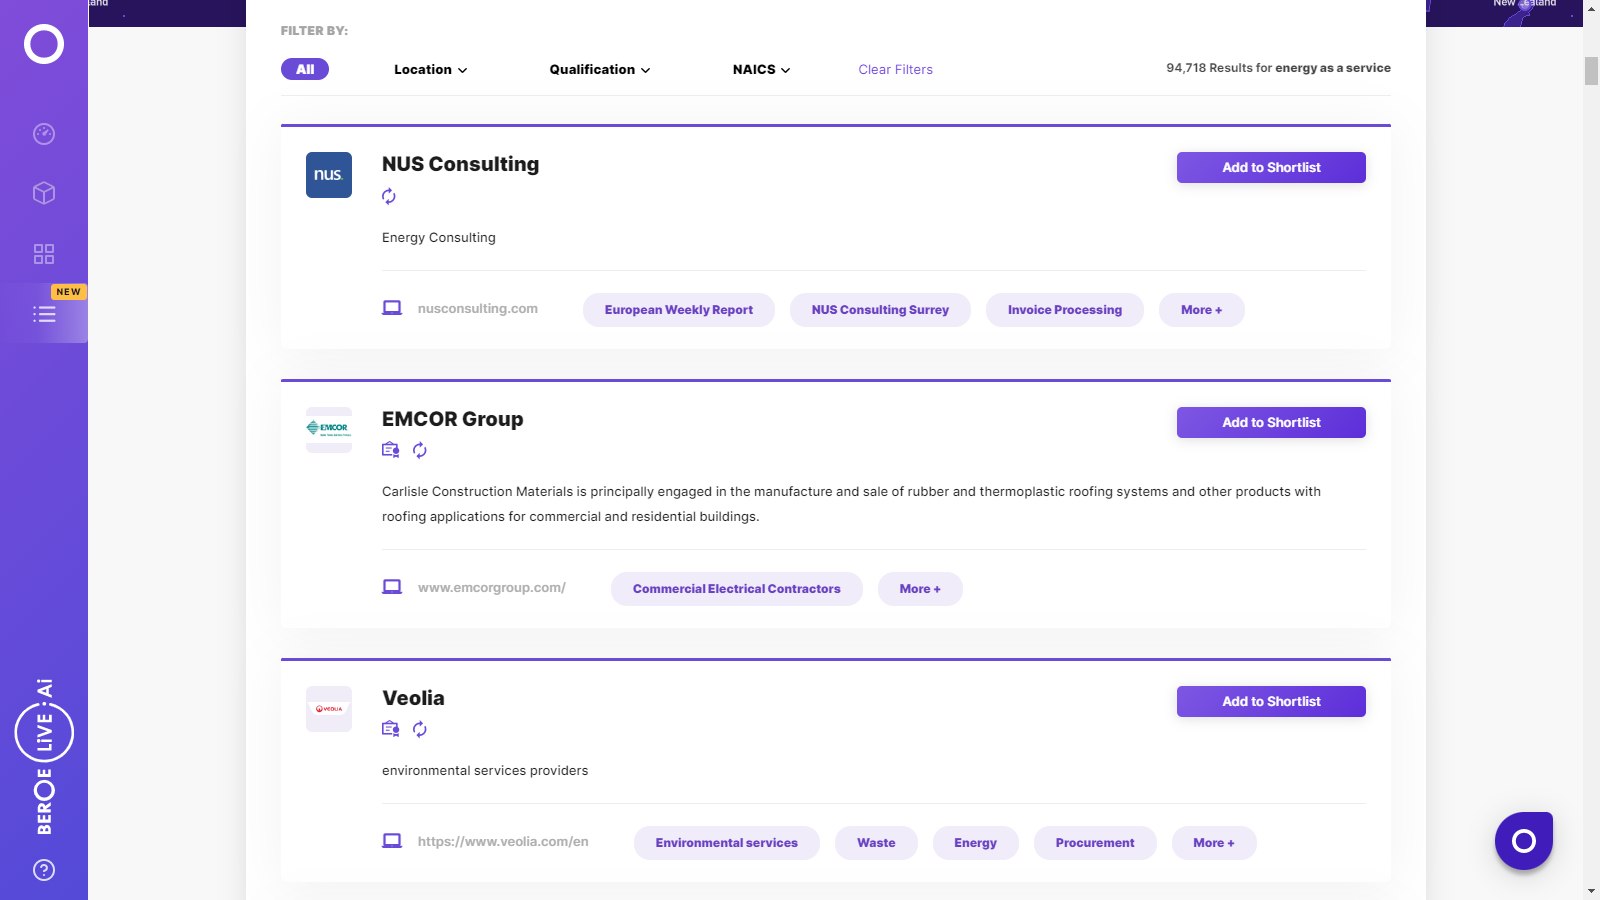
Find the right-fit energy as a service supplier for your specific business needs and filter by location, industry, category, revenue, certifications, and more on Beroe LiVE.Ai™.
Schedule a Demo

Use the Energy As A Service market, supplier and price information for category strategy creation and Quaterly Business Reviews (QRBs)
Schedule a DemoEnergy As A Service market report transcript
EaaS Global Market Outlook:
-
The global energy as a service investment is expected to increase by 5-8 percent in 2022 compared to its previous year to reach $78 billion
-
The increase in market size is expected due to the government policies pushing reduced energy and internal sustainability goals of industrial conglomerates
-
The restored commercial and industrial activities after the lifting of lockdown impositions will help companies to look for optimization of energy use and reduce energy bills by implementing suitable measures
Energy as a Service: Global
-
Energy-as-a-Service builds on growing Renewable Energy Potential and the need for implementation of Energy Efficiency Projects to reduce the Energy costs of the companies. The market share for energy as a service business model is expected to dominate by Europe, North America and APAC regions globally.
-
The market potential for EaaS business model is expected to reach $104 billion by 2025. The market for EaaS includes sale of energy (mostly renewable), energy efficiency projects, analytics etc. The intension to reduce the increasing energy costs and decarbonization are the main drivers of energy as a service business
-
The regulations by governments in most of the countries in these regions to reduce the energy consumption year-on-year is driving the market for investments on energy efficiency and green energy
-
The trends continue to increase due to the new financing schemes like ESCO has been driving the improvements in Industrial Energy Efficiency. The PPAs have boosted in the improvements of renewable energy. The EaaS model reduces the risk of capital investment on the customer which encourages them to explore energy portfolio projects through this model
Porter's Analysis on EaaS
Supplier Power
-
The companies offering RE services and conventional EE solutions (LED, Building controls, etc.) will have low bargaining power, due to the existence of very high number of suppliers
-
The companies offering alternative technology products, which are unique, will have medium bargaining power
Barriers to New Entrants
-
The threat of new entrants for traditional equipment manufacturing companies is low, as the market is already fragmented
-
With the IT giants looking to invest in this line of business, the threat of new entrants is high
-
The push for Internet of Things, Industry 4.0 or digitalization of energy is paving way for the IT giants into energy sector
Intensity of Rivalry
-
Intensity of rivalry is high, as most of the companies offer energy-efficient technologies, which do not differ much from their rival companies
-
This forces the suppliers to have a strong focus on emerging technologies and unique solutions
Threat of Substitutes
-
The obvious substitution for RE would be electricity generated from fossil-fuel or nuclear power stations
-
Despite economic benefits from fossil fuel generated power, the push from governments to reduce GHG emissions through renewable and EE keep the threat of substitutes as low
Buyers power
-
Buyers power is medium, due to the large number of small-sized buyers and small number of energy supplier
-
Buyers have medium power, as they have the option to shift to different generators, due to the low cost offered by energy supplier
-
For low-risk energy saving solutions, customer has medium to high bargaining power. due to market maturity with more number of suppliers
Interesting Reads:
Discover the world of market intelligence and how it can elevate your business strategies.
Learn more about how market intelligence can enable informed decision-making, help identify growth opportunities, manage risks, and shape your business's strategic direction.
Get Ahead with AI-Enabled Market Insights Schedule a Demo Now