CATEGORY
Polyols
The polyolsmarket is an end-use derivative of the corn market. Wet milling of corn also yields the polyol end-products such as Sorbitol, Xylitol and others which find application in many industries.
Beroe LiVE.Ai™
AI-powered self-service platform for all your sourcing decision needs across 1,200+ categories like Polyols.
Market Data, Sourcing & Supplier Intelligence, and Price & Cost Benchmarking.
Schedule a DemoThe World’s first Digital Market Analyst
Abi, the AI-powered digital assistant brings together data, insights, and intelligence for faster answers to sourcing questions
Abi is now supercharged with GPT4 AI engine. Enjoy the ease of ChatGPT, now on Abi
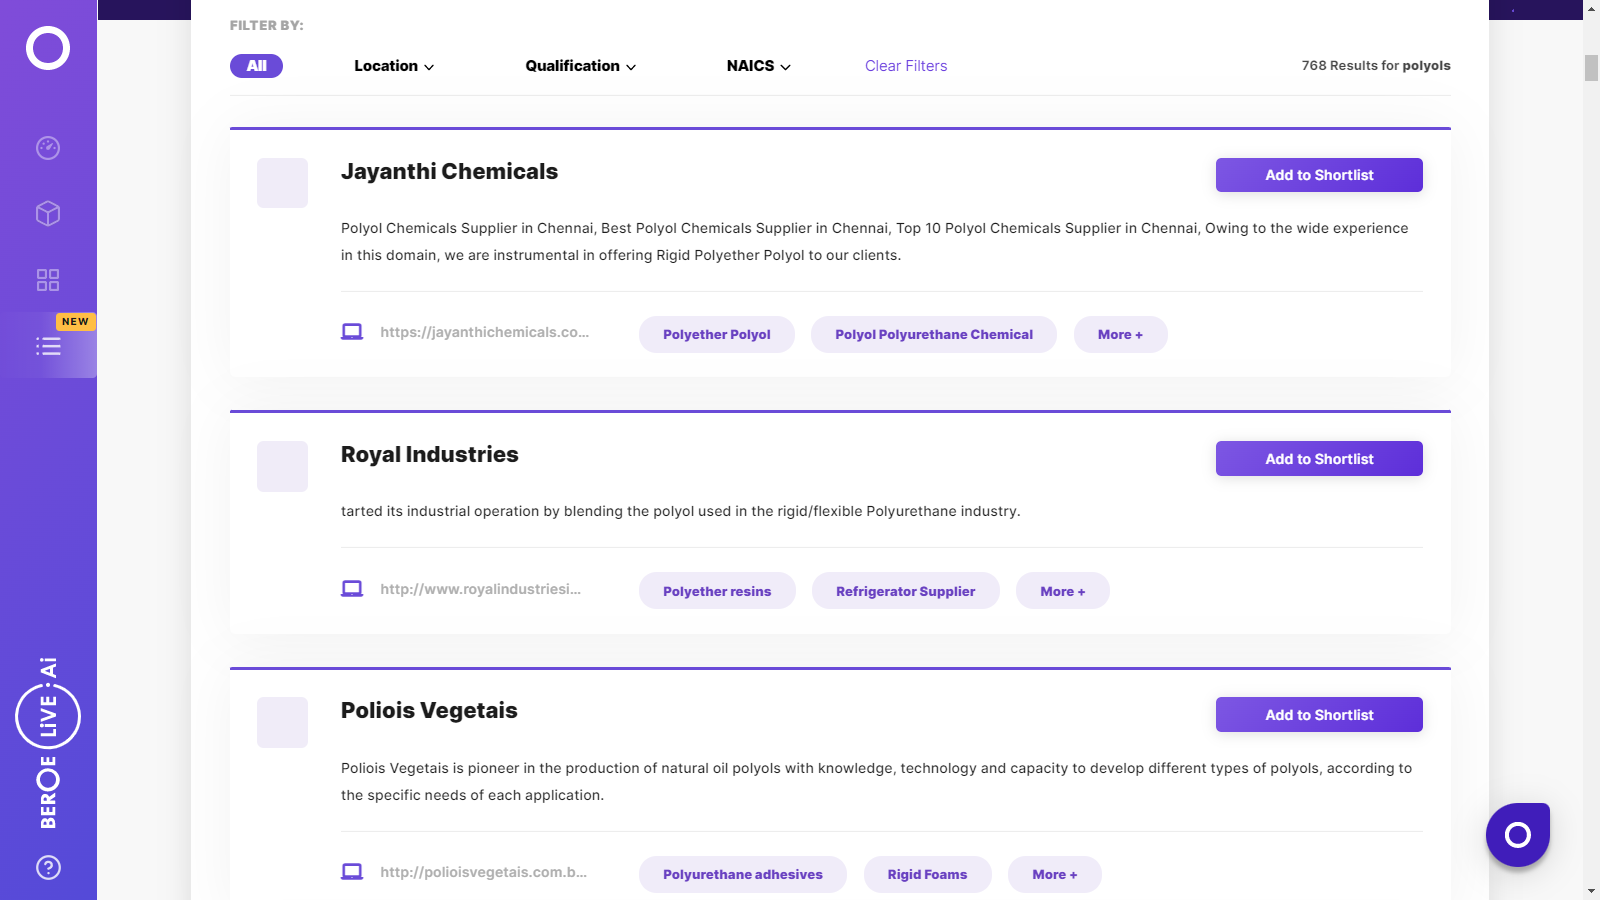
Polyols Suppliers

Find the right-fit polyols supplier for your specific business needs and filter by location, industry, category, revenue, certifications, and more on Beroe LiVE.Ai™.
Schedule a DemoCreditsafe Rating


Use the Polyols market, supplier and price information for category strategy creation and Quaterly Business Reviews (QRBs)
Schedule a DemoPolyols market report transcript
Global Market Outlook on Polyols
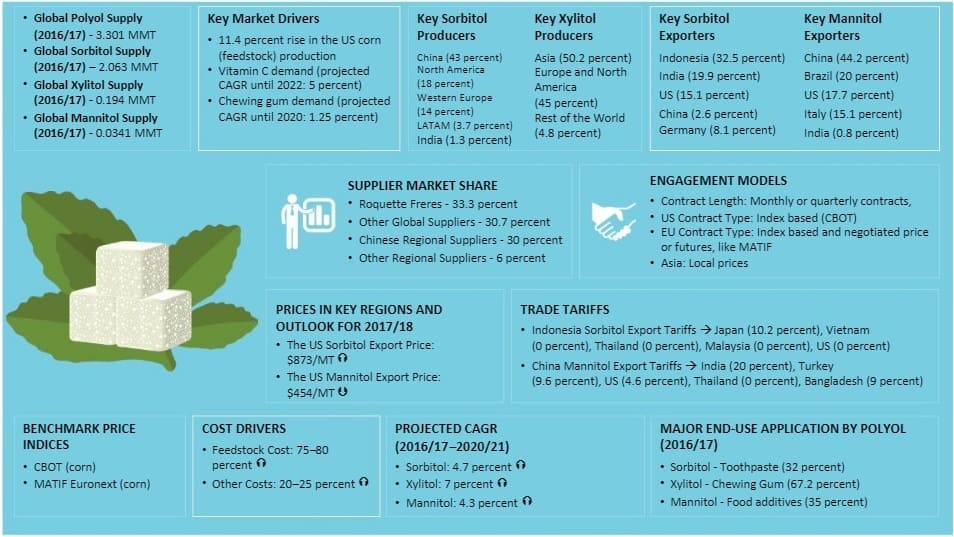
- The global supply of polyols has increased at a CAGR of 2.6 percent over five years. Production in 2016/17 is around. 3.301 MMT
- Consecutive record production of corn (feedstock) in the US and China and demand from end-use segments, such as Vitamin C, toothpaste, and chewing gum industries, drive the market growth
- In case of individual polyols, global sorbitol production is set to rise at a CAGR of 4.7 percent by 2020/21, while xylitol and mannitol markets could rise at a CAGR of 7 percent and 4.3 percent, respectively, during the same period
- Sorbitol is the most commonly used polyol, due to lower production cost, but the health benefits of xylitol and mannitol could ensure that the latter two offer competition to sorbitol in the coming years

Global Polyols - Supply Analysis
- The global production has increased by 8.3 percent between 2013 and 2017, owing to demand from end-use industries and is projected to rise further by 5 percent in 2017/18
- The end-use industries, such as food and pharmaceutical sectors, and the abundant availability of cheap feedstock (corn) drive supply
- The global polyol production has increased at a CAGR of 2 percent between 2013 and 2016, due to the rising demand from major end uses, particularly the food and pharmaceutical industries
- Sorbitol is the most widely used sugar alcohol, accounting for an estimated 59 percent () of the global production, due to its relatively lower cost, compared to other alternatives, such as xylitol and mannitol
Global Polyols - Demand Analysis
- Vitamin C manufacture is the primary driver of polyol demand in China, which accounts for an estimated 46 percent of the global polyol consumption
- In the West, particularly the US and EU, polyols find applications in the pharmaceutical sector, on the account of their perceived health benefits
Global End Use Applications of Polyols
- Demand for polyols is rising, due to health awareness and increased usage in the food and pharmaceutical industries
- Sorbitol has the largest market share among polyols, with applications in Vitamin C production, diabetic, dietetic foods & beverages
- Industrial application includes Vitamin C manufacture, using sorbitol
- Xylitol is a healthier substitute for sorbitol but incurs higher cost. Research on cost-effective xylitol production methods is underway
Global Polyol Consumption
- Global consumption share by region reflects sorbitol usage to a greater extent, due to its market size as compared to other polyols China, North America, and the EU are the major consuming regions
- In China, Vitamin C manufacture is a major demand driver of polyol production
Polyols Market Overview
- Bulk of sorbitol produced globally is consumed by China, North America (mainly the U.S.), and Western Europe.
- Toothpaste and F&B remain the top end-use applications. The toothpaste segment, in particular, is expected to grow at a CAGR of over 4 percent from 2016 to 2023.
- China has a major share of sorbitol use (43 percent) in almost all applications, followed by the North America sorbitol market, mainly the U.S. (18 percent).
- Chinese Vitamin C production accounted for 90–95 percent of the global output during 2012–2015.
- The feedstock is corn. Corn traders and farmers are the major suppliers.
- Polyol manufacturers, like Roquette, Cargill, and others, buy corn directly from grain elevators
- The polyols prices are fixed according to futures like, CBOT or current domestic prices.
- The suppliers do not have major power, since polyols prices are fixed by the global supply–demand trend.
- Supplier power is moderate, as demand for polyols also impacts negotiation.
- The polyols market is consolidated by global suppliers, who account for 64 percent of the market share.
- There is, however, competition from regional suppliers in China and other parts of Asia.
- There is a threat of substitution for polyols, with substitutes such as stevia, aspartame, and others. Sorbitol itself is a substitute for sugar.
- Sorbitol can be substituted by Xylitol, still it is not cost-effective to compete with sorbitol, but there exists growth potential, due to health benefits.
- The threat of substitutes is thus moderate.
Why You Should Buy This Report
- Information about global polyols market size, demand and supply analysis, trade dynamics, and pricing trends of sorbitol, xannitol and mannitol.
- Porter’s five force analysis and major innovations and trends of the global polyols market, and feedstock analysis.
- Supplier market share and profiles of key suppliers.
- Best industry practices and contract structure.
Interesting Reads:
Discover the world of market intelligence and how it can elevate your business strategies.
Learn more about how market intelligence can enable informed decision-making, help identify growth opportunities, manage risks, and shape your business's strategic direction.

