CATEGORY
Hydrocolloids
Hydrocolloids, also called as gums are hydrophilic polymers majorly produced from vegetables, animals and microbial origin. The vital application of the fast hydrated gums such as Guar gum and Xanthan gum in the oil industry is the significant market driver for the hydrocolloids
Beroe LiVE.Ai™
AI-powered self-service platform for all your sourcing decision needs across 1,200+ categories like Hydrocolloids.
Market Data, Sourcing & Supplier Intelligence, and Price & Cost Benchmarking.
Schedule a DemoThe World’s first Digital Market Analyst
Abi, the AI-powered digital assistant brings together data, insights, and intelligence for faster answers to sourcing questions
Abi is now supercharged with GPT4 AI engine. Enjoy the ease of ChatGPT, now on Abi
Hydrocolloids Suppliers

Find the right-fit hydrocolloids supplier for your specific business needs and filter by location, industry, category, revenue, certifications, and more on Beroe LiVE.Ai™.
Schedule a DemoCreditsafe Rating


Use the Hydrocolloids market, supplier and price information for category strategy creation and Quaterly Business Reviews (QRBs)
Schedule a DemoHydrocolloids market report transcript
Hydrocolloids Global Market Outlook
- Global supply of hydrocolloids has been rising at a CAGR of 5.80 percent over a period of five years. Asia Pacific and the US are the major producers and consumers of hydrocolloids
- Food industry, pharmaceutical and personal care use the three months fixed price contracts
- Currently, the oil and gas industry holds a significant share by volume, by entering into a contract period of anywhere between one to twelve months based on the demand for oil
- Other small buyers prefer spot buying
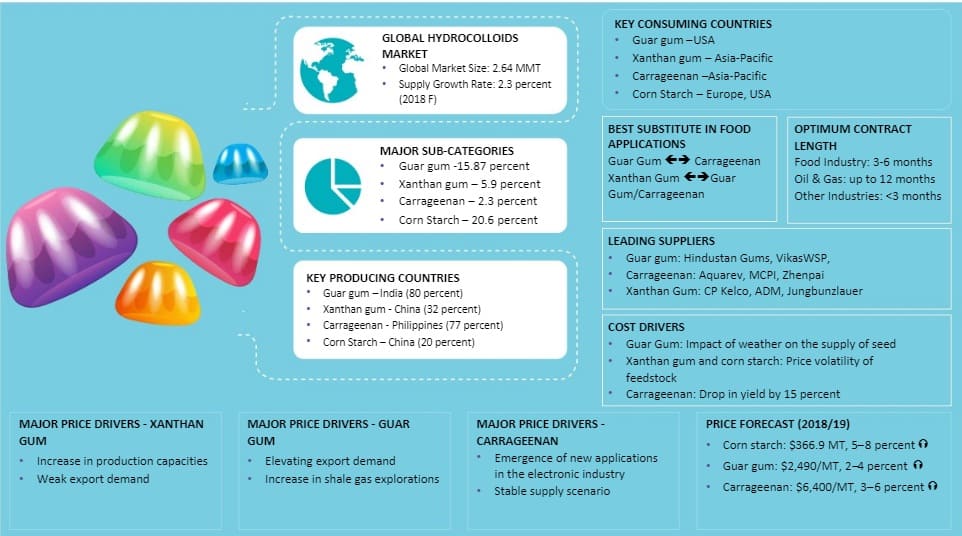
- The leading hydrocolloid supplier: Guar gum: Hindustan Gums, VikasWSP. Carrageenan: Aquarev, MCPI, Zhenpai. Xanthan Gum: CP Kelco, ADM, Jungbunzlauer.
- The global hydrocolloids Market Size: 2.64 MMT and the Supply Growth Rate: 2.85 per cent (2019 E).
- According to cellulose gum procurement intelligence the key consuming countries: Guar gum –U.S.A., Xanthan gum –Asia-Pacific, Carrageenan –Asia-Pacific and Corn Starch –Europe, U.S.A.
- The key producing countries: Guar gum –India (80 per cent), Xanthan gum - China (32 per cent), Carrageenan - Philippines (77 per cent), Corn Starch –China (20 per cent).
- Major sub-categories in the hydrocolloids market: Guar gum -15.87 percent, Xanthan gum –5.9 per cent, Carrageenan –2.3 per cent, Corn Starch –20.6 per cent.
- The major price drivers for carrageenan are the emergence of new applications in the electronics industry and a stable supply scenario.
- The major price drivers for xanthan gum are increasing in production capacities and weak export demand.
- The major price drivers for guar gum are elevating export demand and an increase in shale gas exploration.
- The contract period for guar gum procurement by the food industry varies from 3-6 months
-
The contract periods (as provided in the below chart), a cost saving of approximately 1–3 percent can be achieved compared to spot buying. Since the prices are expected to dip in October for a while and trend upwards, it is recommended to enter into contract during Q1 2019
Global Supply-Demand Analysis
- The hydrocolloid supply is expected to increase by 2.3 percent in 2017 compared to the previous year
- Supply of hydrocolloids is expected to increase in 2018, along with the elevating demand
- Corn starch leads the hydrocolloids market segment, followed by guar gum due to the steep demand from the oil and gas industry and the food sector
- The use of xanthan gum and carrageenan in the food and beverage industry has been in demand owing to the increasing health consciousness among the consumers and multi-functionality of hydrocolloids. Other hydrocolloids such as alginates, agar and CMC hold a minor share
Global Supply –Guar Gum
- Guar gum production is anticipated to increase in 2017 – 2018, owing to a possible rise in demand for crude oil. The oil and gas industry has a significant influence on the guar gum market, since it is used as drilling aids in order to maintain viscosity and reduce friction during oil well fracturing and stimulation process. There has been a continuous average growth in the guar gum market and this trend is bound to continue in the future
- India is the leading producer of guar seed and exporter of guar gum in the world, accounting for about 80-85 percent of global guar seed and gum production, followed by Pakistan (10-12 percent) T
- Global production of guar gum spiked during the shale gas boom period. However, production fell significantly by 28.5 percent from 2013 to 2014 mostly due to the crash of the crude oil market, leading to the lower gas and oil exploration, thereby impacting the import demand for guar gum
- However, the outlook for guar in the long term is viewed to be optimistic, based mainly on the large and sustained demand for guar gum particularly in North America created by the shale revolution and the exploration of new oil reserves in China
Global Demand by Application –Guar Gum
- Guar gum demand shot up from 2012 to 2014 in the oil and gas industry, this lead to other end use industries like food, textile, paper printing to replace guar gum with the other thickeners.
- Food grade gum, which accounted for 50 percent of the usage between 2008-2012, came down to a mere 18 percent in 2016 as food manufacturers shifted to alternative sources such as Carboxymethyl Cellulose (CMC) and Xanthan gum
- The consumption of guar gum in the oil and gas industry increased as guar, being a natural thickener and easily bio- degradable, has a higher preference compared to other synthetic gums.
Market Overview
The carrageenan market is expected to grow at a CAGR of approx. 5 per cent until 2018, due to the increasing demand for processed food and meat products, mainly in the APAC and Europe.
More than 80 per cent of xanthan gum is manufactured in Asia and Europe. With the increased usage of xanthan gum in the oil and gas industry, production and expansion activities were seen on a rise in China.
Why You Should Buy This Report
- This report gives the hydrocolloids market gives cellulose gum procurement intelligence, market analysis, supply-demand analysis and trade analysis of the regional and global market of guar gum, xanthan gum, carrageenan and corn starch.
- The report gives the cost structure analysis of guar gum.
- It gives Porter’s five force analysis and supplies intelligence on the xanthan gum, carrageenan and corn starch.
Interesting Reads:
Discover the world of market intelligence and how it can elevate your business strategies.
Learn more about how market intelligence can enable informed decision-making, help identify growth opportunities, manage risks, and shape your business's strategic direction.