CATEGORY
Chlor-Alkali
Chlor alkali chemicals are the bulding blocks of most of the daily use products. Of these, caustic soda and soda ash are key products that find usage in end use markets such as paper & pulp, alumina, soaps & detergents.
Beroe LiVE.Ai™
AI-powered self-service platform for all your sourcing decision needs across 1,200+ categories like Chlor-Alkali.
Market Data, Sourcing & Supplier Intelligence, and Price & Cost Benchmarking.
Schedule a DemoThe World’s first Digital Market Analyst
Abi, the AI-powered digital assistant brings together data, insights, and intelligence for faster answers to sourcing questions
Abi is now supercharged with GPT4 AI engine. Enjoy the ease of ChatGPT, now on Abi
Chlor-Alkali Suppliers

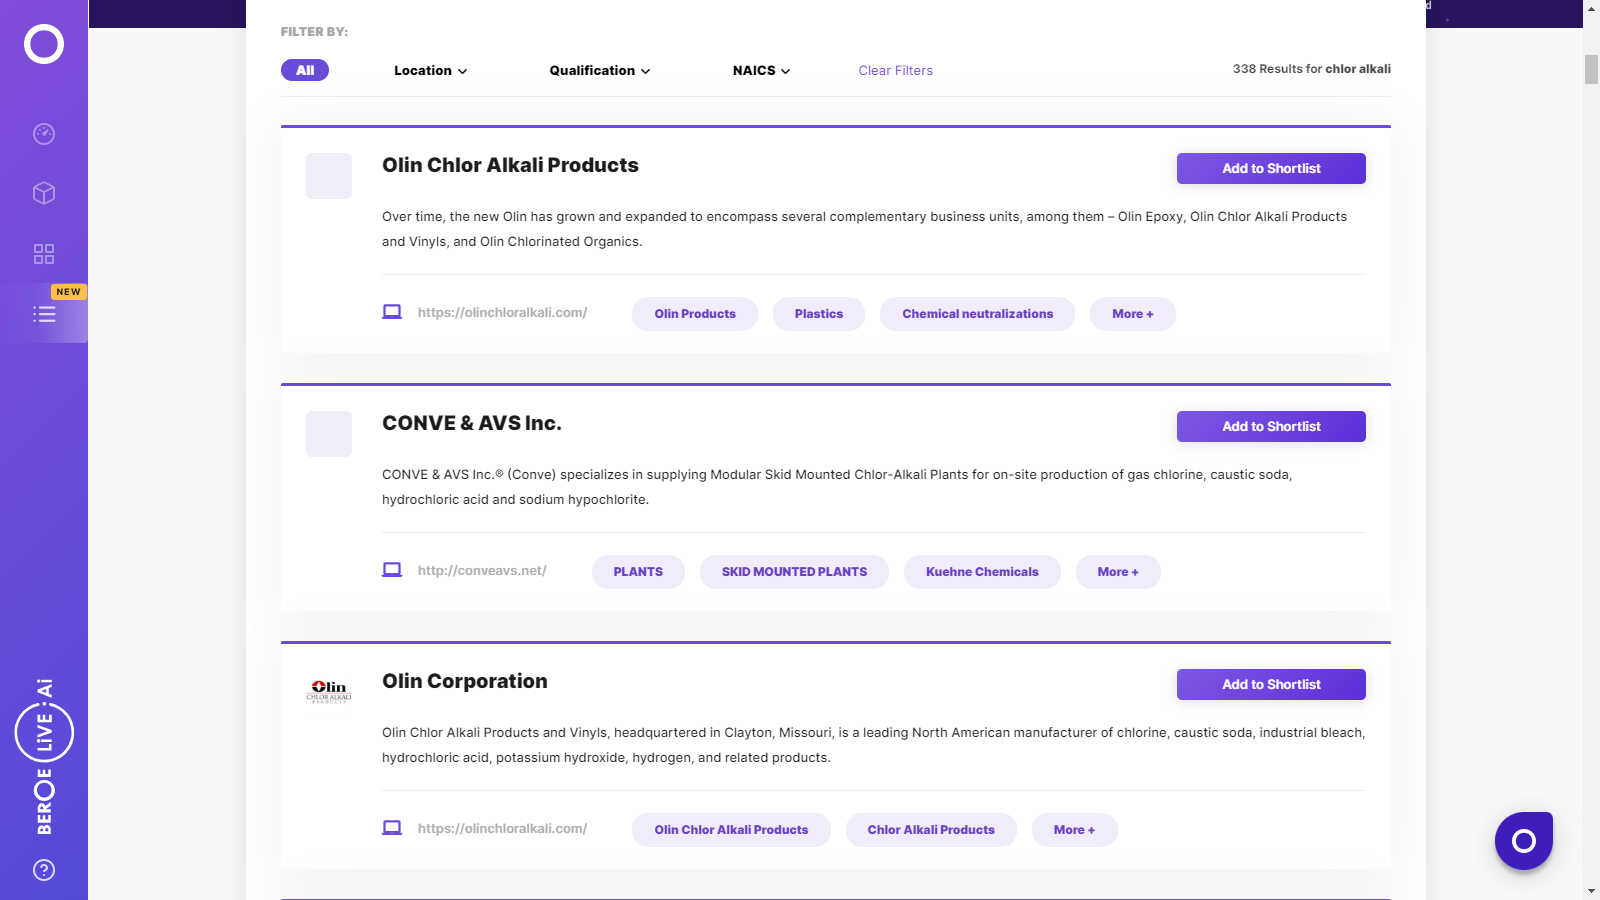
Find the right-fit chlor-alkali supplier for your specific business needs and filter by location, industry, category, revenue, certifications, and more on Beroe LiVE.Ai™.
Schedule a DemoCreditsafe Rating


Use the Chlor-Alkali market, supplier and price information for category strategy creation and Quaterly Business Reviews (QRBs)
Schedule a DemoChlor-Alkali market report transcript
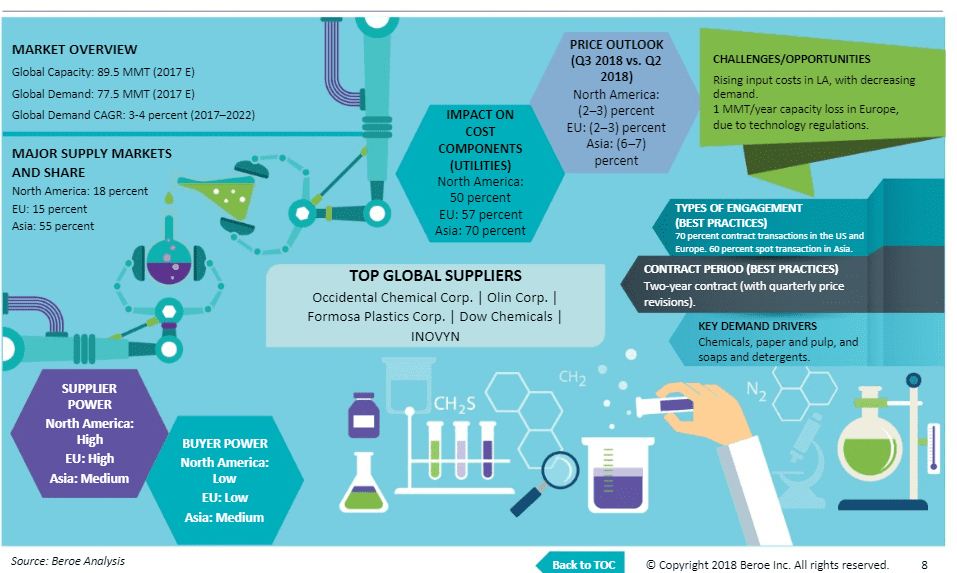
Chlor-Alkali Market Analysis and Global Outlook
- The global demand is expected to grow at about 4–5 percent CAGR through 2019–2024
- Asia is expected to drive the demand for caustic soda, due to an anticipated increase in the usage of paper, food and beverages, personal care products and synthetic fibres
- The per-capita consumption of caustic soda is not as saturated in Asia as it is in the Western markets

Demand Market Outlook
The global caustic soda market is facing supply crunch, with increasing demand from downstream alumina and pulp industry, and few capacity additions of about 1.5 MMT/year are planned in the U.S., Europe, and Asia, planned by 2020–2022. The buyer power is anticipated to decrease, as buyers may face stiff competition securing cargoes over the period.
Global Market Size: Caustic Soda
- The global caustic soda market is expected to reach $54 billion by 2024. The key market driving end use is the CPG segment (paper packaging, food & beverage, and personal home care chemicals).
- The Asian market is expected to witness a high growth rate of approx. 6 percent CAGR, followed by the Middle East, ranging from 4 to 5 percent CAGR
- Saturated markets, like the U.S. and Europe, are expected to witness a growth of approx. 3 percent CAGR between 2019 and 2024.
Global Capacity–Demand Analysis
- Buyers from the CPG industry (typically small-scale buyers in the caustic soda market) will encounter issues, such as securing supplies and increase in chlor alkali price trends price premiums, especially in Europe, due to the impending capacity loss, with no major capacity additions in major markets in the coming years
- Supply–demand gap will shrink from an estimated +9 MMT in 2017 to +3 MMT in 2024
Market Outlook
- Capacity Removal:
–The EU mandate to shut down all mercury based plants by December 2017 in Europe has led to plant conversions to membrane cell technology.
–It has also resulted in overall capacity loss of about 1MMT in Europe as major players in Western Europe will be producing caustic potash instead of caustic soda.
- Capacity Dynamics:
– At the beginning of 2017, the mercury technology accounted for 17.4 percent of EU production capacity, embrane production was 66 percent
– Approximately 7.5 MMT/year new capacities came online in 2015, of which, approx. 7 MMT was from Asia
- Future Capacity Additions:
– Few capacity additions of approx. 500 KMT/year in the Middle East and Asia are under the study phase
Supply Dynamics:
- Low operating rates (50%) from alumina producer, Hydro Alunorte, in Brazil have resulted in 300 KMT/year loss of exports from the US Gulf in 2018. Australian buyers of caustic soda are engaging with Asian producers for 2019 contracts, due to lower chlor-alkali prices in Asia and proximity to Australia.
Future Capacity Additions:
- Few capacity additions of approx. 1.5 MMT/year are planned in the U.S., Germany, and Thailand. Indian producers, including GACL, Aditya Birla group, may announce capacity additions in the coming years, to cater to increasing demand
- Engagement Outlook Equal Weightage for Spot and Contracts: Most suppliers in the U.S. and Europe engage in yearly contracts with buyers, however, Asia witnesses more of spot buying, due to a very fragmented market with ample suppliers in the chlor alkali market
Global Demand by Application
- S&D&T is a strategic segment in the eyes of caustic soda suppliers, the overall volume from individual buyers of the CPG segment would be perceived as small-scale buyers in the fragmented chlor-alkali market
- The top three major demand-driving segments: −Organic and inorganic chemicals: 3 percent CAGR −S&D&T: 3 percent CAGR −Pulp & paper: 4.4 percent CAGR
- Co-product downstream demand could impact the caustic soda market supply −Globally, close to 60 percent of chlorine is used in PVC production −The usage of PVC has been decreasing in the U.S. and Europe, due to sustainability and environmental concerns −A complete reduction of PVC usage for daily use and food packaging materials is likely to curb chlorine production, thereby resulting in the reduction of caustic supply
Global Trade Dynamics
- North America: Second largest exporter, with a consistent trade surplus of 3 MMT/year for the past five years
- Europe: Net importer for the past two years, due to chlorine handling issues
- Asia: Largest exporter, however, the exports have been lowering from China from the past five years.
- Middle East: A net exporter, with Europe and Africa as its import partners
- LA: Net importer, with 50 percent demand being met via imports (the U.S. is the main sourcing destination, catering to 50 percent of LA’s demand
Interesting Reads:
Discover the world of market intelligence and how it can elevate your business strategies.
Learn more about how market intelligence can enable informed decision-making, help identify growth opportunities, manage risks, and shape your business's strategic direction.

