CATEGORY
Lithium And Organometallic Compounds
Global LCE supply is expected to remain deficit up to 2020. However,the supply-demand gap is expected to gradually reduce in anticipation of several new capacity expansions expected to come online by 2020
Beroe LiVE.Ai™
AI-powered self-service platform for all your sourcing decision needs across 1,200+ categories like Lithium And Organometallic Compounds.
Market Data, Sourcing & Supplier Intelligence, and Price & Cost Benchmarking.
Schedule a DemoThe World’s first Digital Market Analyst
Abi, the AI-powered digital assistant brings together data, insights, and intelligence for faster answers to sourcing questions
Abi is now supercharged with GPT4 AI engine. Enjoy the ease of ChatGPT, now on Abi
Lithium And Organometallic Compounds Suppliers
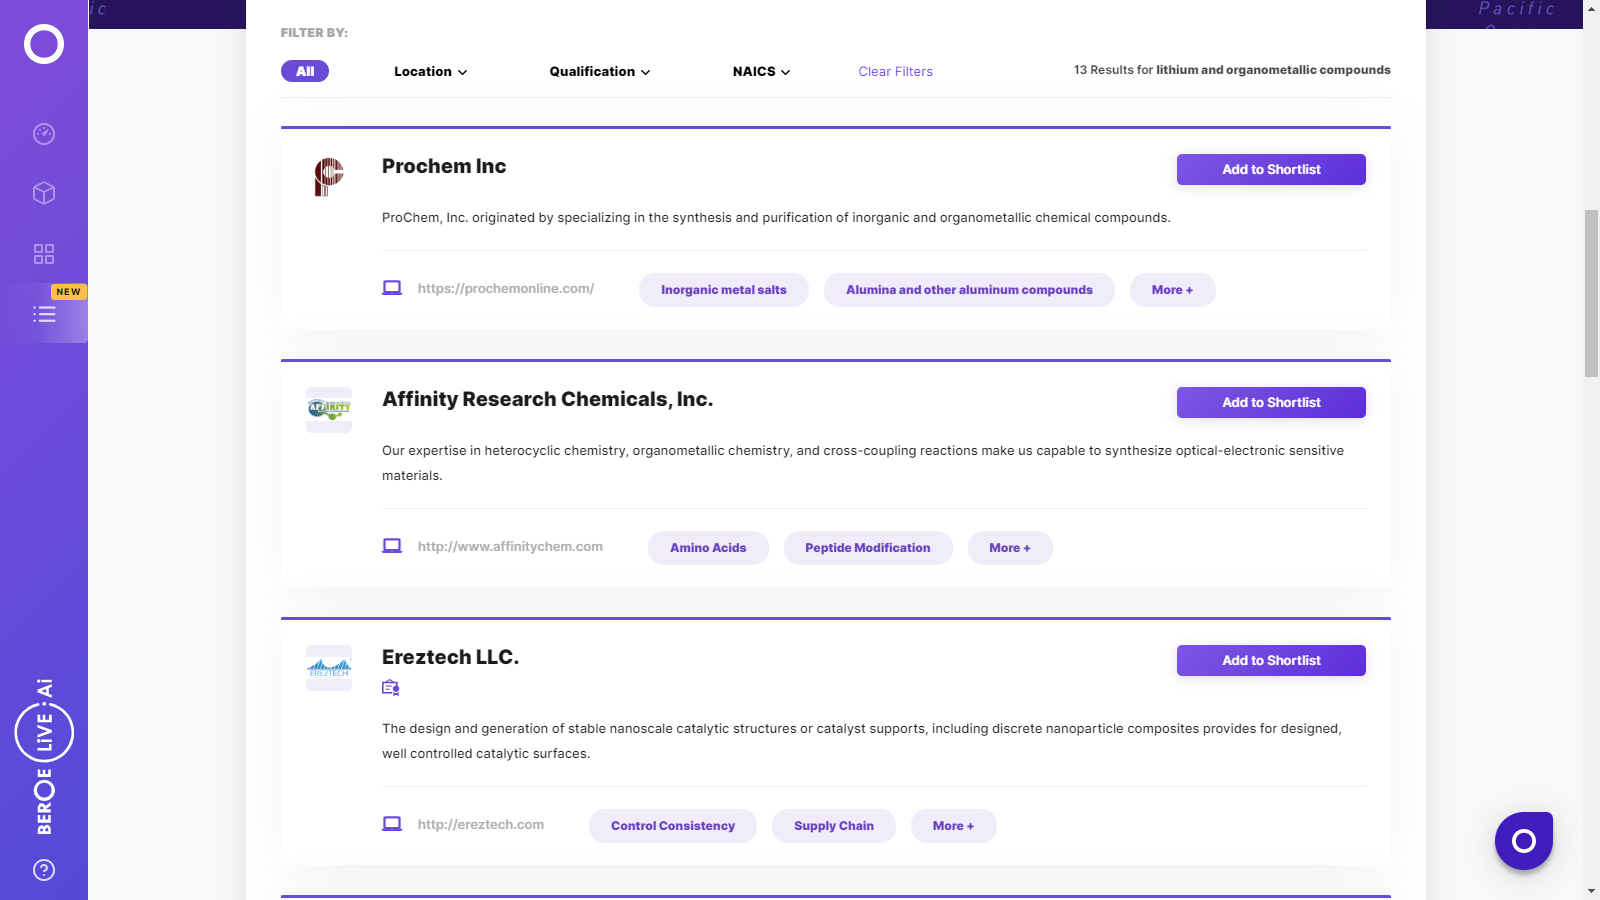
Find the right-fit lithium and organometallic compounds supplier for your specific business needs and filter by location, industry, category, revenue, certifications, and more on Beroe LiVE.Ai™.
Schedule a DemoCreditsafe Rating


Use the Lithium And Organometallic Compounds market, supplier and price information for category strategy creation and Quaterly Business Reviews (QRBs)
Schedule a DemoLithium And Organometallic Compounds market report transcript
Global Market Outlook on Lithium And Organometallic Compounds
The global LCE market is expected to remain short supplied up to 2020, owing to the tremendous demand witnessed from the batteries segment. The market will continue to remain deficit if all the various planned capacity expansions do not come online by 2020–2021.
Global LCE Supply–Demand Dynamics
- The global LCE market demand has been constantly outpacing supply since 2016. The market is expected to remain deficit until 2020 and even beyond. However, the supply–demand gap is expected to slowly reduce, owing to the various capacity additions by major manufacturers and junior miners
- Lithium brine production is expected to witness an increasing trend during 2017–2020, supported by capacity additions by major manufacturers
- The major reason for the short supply is primarily due to the spiraling demand from the rechargeable batteries market, which are used in EVs. The LCE demand has been growing at a rate of 10–12% between 2015 and 2020 and is expected to further increase to 12–15% between 2020 and 2025, when EVs hit the commercial market
Lithium Deposits by Type: 2017
- Brines and hard rock ores (pegmatite's) are the main sources for commercial lithium production. There are three main types of brine deposit – continental, geothermal, and oil field with the most common being continental saline desert basins. It constitutes the majority share of lithium production, as it is easier to explore and the cost of production is cheaper compared to hard rock mining
- Lithium concentration in pegmatite's is much higher than in brines. Thus, deposits with extremely high lithium values may be economically viable compared to brine harvesting
Global Lithium and Lithium Derivatives Market Trend and Outlook
Unlike lithium carbonate and lithium hydroxide, the dominant uses of LiCl and LiBr are for the manufacture of lithium metal and industrial drying, respectively.
Lithium Hydroxide (LiOH)
- Capacity Demand Dynamics: It is the second most used lithium metal after lithium carbonate. Despite sufficient total lithium hydroxide capacity, there is lack of battery grade lithium hydroxide to meet the demand from the rapidly growing battery market, which has led to tightened supply situation and the rise in lithium hydroxide prices.
- Major Regional Producer: Currently, China is the major producer of lithium hydroxide with more than 40,000 MT while the remaining 20,000 capacity is outside China.
- Expensive Cost of Production: The average cost of hydroxide production in China is 50% higher that Rockwood Lithium's production cost, but only slightly higher than the cost of production by FMC. Additionally, Chinese producers have to pay 17% VAT on their exports.
- Downstream Trends: The demand for EVs is expected to exceed the demand from greases by 2020. Lithium hydroxide is expected to be consumed more in EVs compared to lithium carbonate and more amount of lithium carbonate will be used for the production of LiOH.
Lithium Chloride and Bromide (LiCl & LiBr)
- Production Process: LiCl is produced by reacting hydrochloric acid with lithium carbonate, while LiBr is manufactured by treating hydrobromic acid with lithium carbonate.
- Lithium metal: Lithium metal obtained by the electrolysis of LiCl is used to make organolithium reagents, like methyl lithium, butyl lithium, etc. Butyl lithium is used to make polymers.
- Restraining factor: The corrosive nature of LiBr will act as a major impediment to the growth of the LiBr market.
Lithium Carbonate – Price Trend and Forecast
There are several new investments on new mine sites for the production of lithium carbonate and they are on an increasing trend. However, supply is expected to remain deficit at least until the end of 2020 with the supply–demand gap progressively decreasing between 2017 and 2020. Prices are expected to remain on an increasing trend until 2020; however, the price levels will not fall back to 2014–2015 price levels.
- LCE prices have been on a spiralling upward trend since 2016, which marked the start of the ‘Battery Boom' and subsequent surge in demand for LCE
- The demand from battery-grade lithium is expected to reach ~ 99,000 MTPA by 2020, which is expected to exert further upward pressure on prices
- Prices are expected to gradually start declining by mid 2019; however, owing to strong demand, no major drop in prices is expected
Interesting Reads:
Discover the world of market intelligence and how it can elevate your business strategies.
Learn more about how market intelligence can enable informed decision-making, help identify growth opportunities, manage risks, and shape your business's strategic direction.