CATEGORY
Corporate Travel
Corporate Travel consists ofsub-categories such as Airlines, Hotels, Car rentals, Travel Management Companies and Online Booking Tools
Beroe LiVE.Ai™
AI-powered self-service platform for all your sourcing decision needs across 1,200+ categories like Corporate Travel.
Market Data, Sourcing & Supplier Intelligence, and Price & Cost Benchmarking.
Schedule a DemoThe World’s first Digital Market Analyst
Abi, the AI-powered digital assistant brings together data, insights, and intelligence for faster answers to sourcing questions
Abi is now supercharged with GPT4 AI engine. Enjoy the ease of ChatGPT, now on Abi
Corporate Travel Suppliers

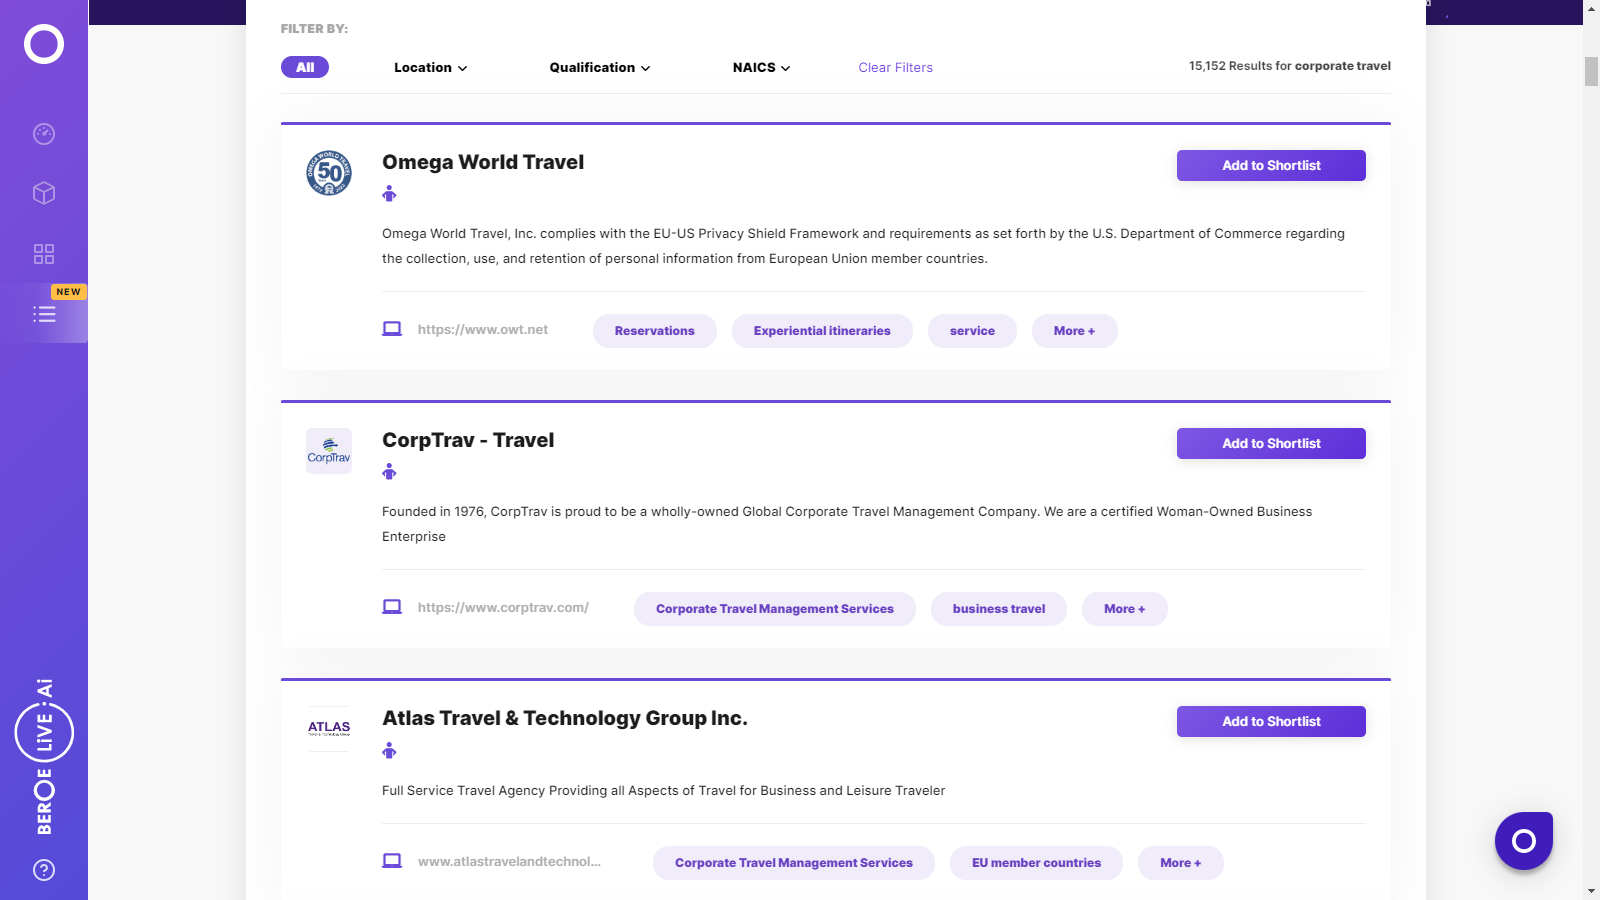
Find the right-fit corporate travel supplier for your specific business needs and filter by location, industry, category, revenue, certifications, and more on Beroe LiVE.Ai™.
Schedule a Demo


Use the Corporate Travel market, supplier and price information for category strategy creation and Quaterly Business Reviews (QRBs)
Schedule a DemoCorporate Travel market report transcript
Global Corporate Travel Industry Outlook
- The world corporate travel market was around $1.3 trillion in 2017, and is expected to grow between 4.7 percent and 5 percent CAGR to reach approx. $1.5–1.79 trillion by 2023.
- Chinese economy witnessed a recent slowdown, but is expected to remain the largest business travel market, with a sustained high growth rate
- The US corporate travel market was impacted by the Presidential election, due to the uncertainties of economic policies, thus affecting the US business new deals and investments

Global Corporate Supply Market Outlook
Airlines
Travel market research shows that growth is expected to soften within the industry, due to increasing risks and the oil prices recording an increase compared to 2017.
Hotels
The major drivers are sustainability initiatives and the adoption of technology.
Car Rentals
The industry is trying to reduce its dependence on the airline market.
TMCs
Traveler security and improved spend visibility are the major drivers for TMCs as per latest travel business intelligence.
Global Corporate Travel Market Maturity
- End-to-end travel management, better access to travel spend, thus increasing visibility, and innovations, such as Uberization, are the factors that contribute to high levels of buyer maturity in North America and Europe
-
Increasing adoption of smartphone and penetration of the internet have resulted in mobile technology as one of the most impactful trends, demanding attention from travel managers
Global Corporate Travel Industry Trends
- Sharing economy has had a major impact on the leisure travel segment but has begun to penetrate, especially in the ground transportation area of corporate travel
- Ancillary revenue is expected to increase for the airlines, as even the full-service careers have started to experiment with unbundling of their services
Global Corporate Travel Market: Drivers and Constraints
- The major drivers of corporate travel are geographical diversity of businesses and expansion of businesses into emerging economies
- Travel requirements are mostly considered by corporates to be additional costs incurred rather than as an investment, which results in this spend area being the first target during any cost-cutting initiative
Drivers
Geographical diversity
- Global organizations are protected from the local market's uncertainty by having diverse businesses across the world
- MNCs have been increasingly expanding their business to emerging economies
Adoption of travel technology
- Increased use of TMS helps TMCs to manage their travel bookings. It allows travel bookers more functionality than the traditional way of booking
- Adoption of the blockchain technology by Hotels for capturing traveler profiles and also managing loyalty programs
- Increased integration of added features with TMS, such as virtual payment solutions like e-wallets to keep all expenses in one place, and booking multi-channel transportation from one place drive TMCs to reach more travelers than ever before
Growth of sharing economy
- The growth of shared economy concepts in the accommodation and ground transport markets have increased with the adoption of Airbnb and Uber like services.
Constraints
Virtual and hybrid meetings
- Increased use of virtual and hybrid technology encourages digital interactions, such as online meetings and conferences, instead of travel
Economic uncertainty
- Despite low oil prices, factors such as a strong US dollar, high market volatility and increasing travel prices, encourage organizations to resort to cost-cutting measures
Internal travel requirement restriction
- Companies are trying to cut down travel frequency by placing stringent travel approval protocols for their internal (non-buyer facing) purposes
Cost Structure Analysis: Spend Categorization
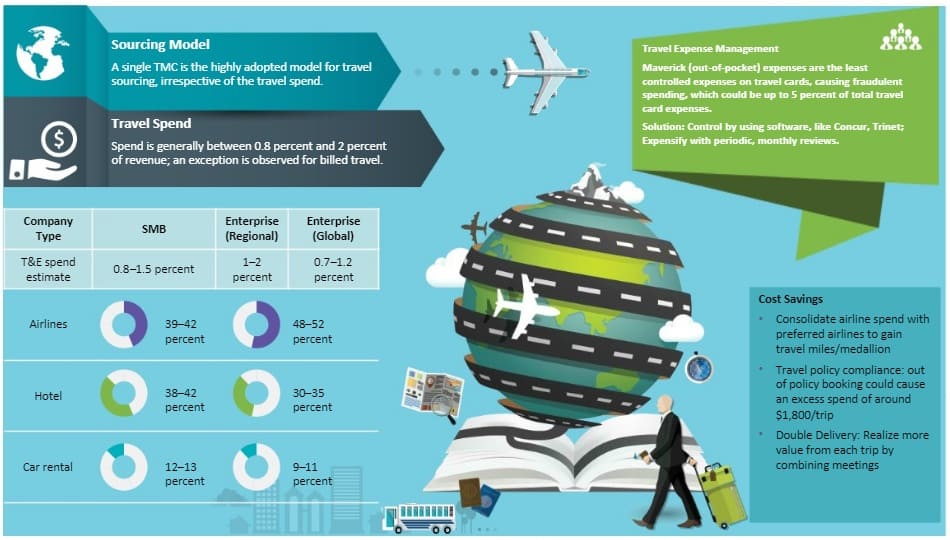
Airlines
- Spend percentage: 45–50 percent
- Spend mix: Both low-cost and full-service carriers are used. The former constitutes a lower volume of spend, typically less than a quarter of an organization’s spend on airlines.
- Discount threshold: Spend with the carrier should be at least $1 million
- Discount percent: 1–20 percent
- Discount levers: More international spend, higher spend in competitive routes, internal compliance to travel policy
Hotels
- Spend percentage: 35–40 percent
- Spend mix: Both hotel chains and independent hotels are used with a greater volume of spend with the chain hotels. Non-compliance is the highest in hotel bookings
- Discount threshold: A global spend not less than $0.5 million
- Discount percent: 10–30 percent
- Discount levers: The average number of days for each stay, days of the week, usage of ancillary services
Car Rentals
- Spend percentage: 17–20 percent
- Spend mix: Higher spend is in car rentals, followed by taxis, chauffeured transportation and ride sharing companies. Ride sharing is gaining popularity with the business traveler
- Discount threshold: Spend with the car rental agency should be higher than $50,000
- Discount levers: More international spend, higher spend in competitive routes, internal compliance to travel policy
TMC
- Spend percentage: 3–7 percent
- Spend mix: A consolidated global TMC is most often the choice because this would help to provide the best visibility on spend
Interesting Reads:
Discover the world of market intelligence and how it can elevate your business strategies.
Learn more about how market intelligence can enable informed decision-making, help identify growth opportunities, manage risks, and shape your business's strategic direction.
Get Ahead with AI-Enabled Market Insights Schedule a Demo Now
