Spreads Analysis – An Indirect Way to Identify Demand Growth


Polyethylene (PE) prices change based on various factors such as demand, supply, monomer, and other factors. However, in order to forecast the annual growth rate, both supply and demand dynamics play a major role. For supply dynamics, capacity addition could be used; however, calculating demand dynamics varies based on numerous factors such as end use demand industries, cross industry growth rate, etc., which would be difficult to arrive at. In this article, we focus on how spreads (differences between ethylene and PE) are used as a tool for demand dynamics, and how buyers can negotiate based on spreads.
Spread Analysis – The U.S.
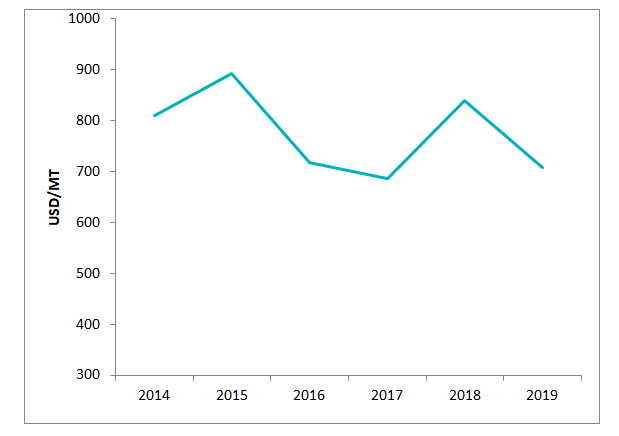
Source: Polymerupdate, Secondary Articles and Beroe Analysis
The spreads between (ethylene and PE) in the U.S. remained broadly in the range of 600–800 USD/MT. The prices of PE fell in line with ethylene monomer in the 2015– 2017 period. In 2019, the prices of ethylene contract prices fell by $81/MT on a Y-o-Y basis, while PE prices fell by over $250/MT. This could be due to the U.S.-China trade war, which impacted the export demand market. Regardless, the margins of the U.S. suppliers are higher when compared to the buyers.
Spread Analysis – Europe
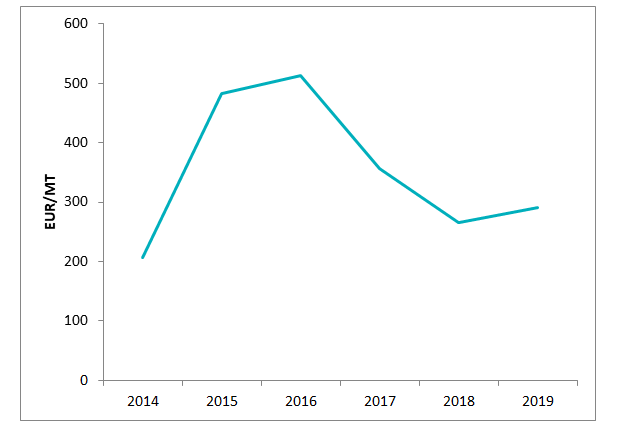
Source: Polymerupdate, Secondary Articles and Beroe Analysis
The spreads between (ethylene and PE) in Europe remained broadly in the range of 480–520 euros/MT in 2015 and 2016. The spreads from 2017 fell in line with competitive prices available from the Middle East and Asia (South Korea and Japan). The spreads in 2018 were at an all-time low (in the last five years), and this scenario broadly continued in 2019. With increasing ethylene prices, the trend could be an advantage for buyers.
Spend Analysis – Asia
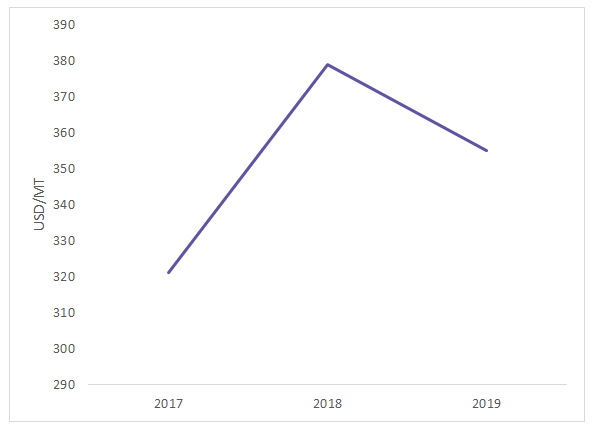
Source: Polymerupdate, Paid Data Bases, Secondary Articles and Beroe Analysis
The spreads between (ethylene and PE) in Asia (China), which are among the lowest of all regions, remained in the range of $320–380/MT. The spreads in 2019 decreased in line with weak demand and uncertainty in trade due to the U.S.-China trade dispute. Competitive imports from the Middle East and better netbacks in the region would prompt surplus materials in Europe to be sold in Asia. However, in 2019, due to weak demand, the prices have been on a declining trend since February. The spreads are broadly in the range of $350–380/MT.
What’s in for Buyers?
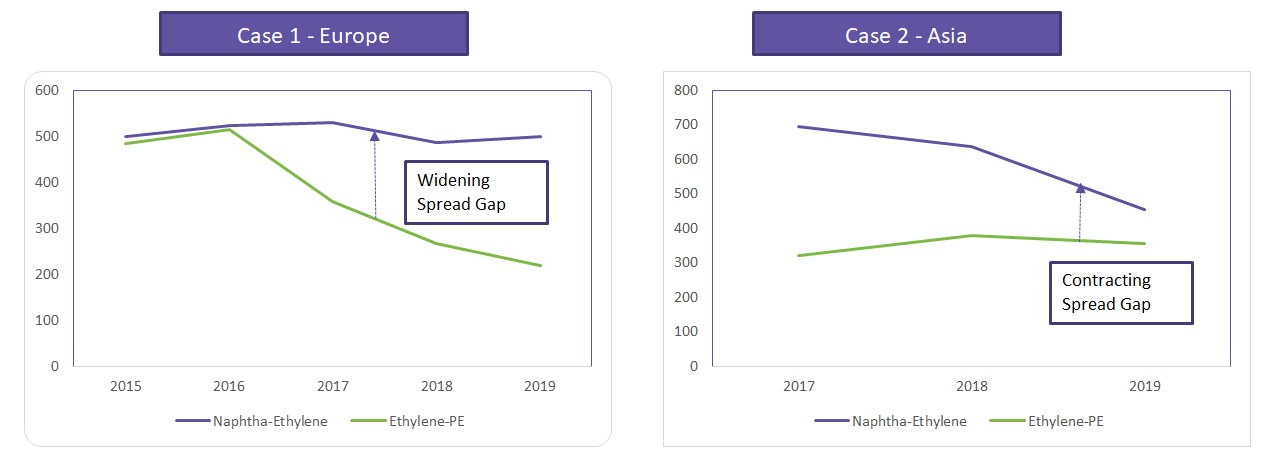
Source: Polymerupdate, Paid Data Bases, Secondary Articles and Beroe Analysis
In case 1, in Europe, the naphtha- ethylene spreads have been firm, while ethylene-PE spreads have contracted in the last 2–3 years, which indicates that an integrated supplier can switch to other value chains of ethylene, namely ethylene oxide, MEG, etc. Therefore, an integrated supplier can still have better margins and negotiating power, whereas in case 2, buyers in Asia would have better negotiating power. Hence, the naphtha-ethylene spreads are also decreasing, and the major source of ethylene in both regions is primarily from naphtha.
Possible Scenarios and How Buyers Can Take Advantage
-
Case 1 – Integrated suppliers can opt for other downstream value chains, and in Europe, prices could remain between 1350–1430 euros/MT in 2019. Competitive prices from the Middle East and South Korea and increases in recycling rates in the region are major causes for the decline in spreads. Hence, if buyers can lock their contracts between 1350–1400 euros/MT for 1 year with quarterly price revisions, it would be a viable option.
-
Case 2 – In Asia, the naphtha-ethylene spreads are decreasing, and hence, the pricing power of suppliers are less compared to that of buyers. The prices are likely to decrease and remain at $1200–1250/MT. In the current case, the inventories of producers would increase. For instance, the inventories of Petrochina and Sinopec—two major producers in China—increased due to the tariff hike announcement by the U.S. from September 2019, and new plant start-ups were expected. Hence, if buyers can lock their contracts between 1150–1200 euros/MT for a year with quarterly price revision, it would result in cost savings.
-
In the U.S., where spreads are the highest due to feedstock advantage and integration levels of suppliers, the spreads have dropped, indicating weak export demand. Suppliers are currently selling export prices at below base line prices in order to be competitive, while domestic prices have remained higher to compensate for lower export prices.
Hence, spreads can be used as an indirect way to calculate demand, and demand and spreads are directly correlated. For instance, quarterly earnings of major global PE producers such as Dow, ExxonMobil, LyondellBasell, Ineos, etc., have declined, which could be due to a drop in demand and the U.S.-China trade war, which impacted the U.S. suppliers. With new capacity additions reported in Asia and the U.S., price wars could be expected, and spreads are expected to decline or remain stable, which would favor buyers in 2020.
References
- Market News, Suppliers Websites, Research Articles
- https://www.polymerupdate.com
- https://www.icis.com/explore/


Get more stories like this
Subscirbe for more news,updates and insights from Beroe