Key Supplier Traits to Thread through Natural Oleochemical Industry Challenges

Abstract
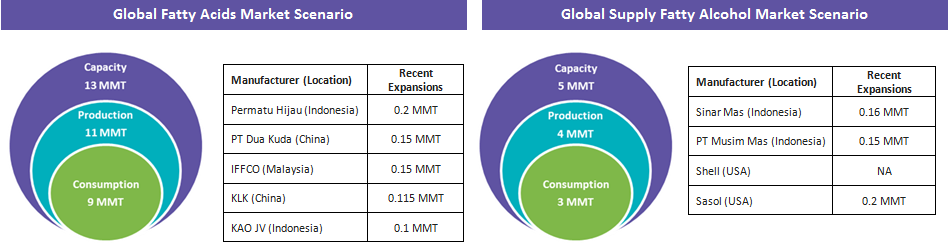
The global oleochemical market is facing more than 10 years of overcapacity. In odds with this, capacity expansions are witnessed every year in both the fatty acids and alcohol markets.
Adding to the fire are other challenges prevailing in the current industry scenario, as follows:
- The U.S. shale gas industry is developing, and crude oil prices are decreasing, making U.S. ethylene economical compared with lauric oils. This, in turn, has made synthetic oleochemicals the real cost leader.
- The demand for synthetic fatty alcohols is expected to command more market share until 2020, impacting the utilization of the natural alcohol sector.
- Synthetic alcohol plant utilization rates are estimated to rise to more than 90%, while natural alcohol plant utilization rates are expected to fall from the current 80% to less than 66% by 2019–2020.
- Asian countries such as China are becoming less efficient with lower utilization rates (under 40%) due to high material costs, lack of import protection, and outdated technology, with plants smaller than 0.1 MMT.
All this could lead a category manager to ask two major questions: (1) which natural oleochemical supplier(s) can survive these challenges? and (2) what are the key competencies to look for while screening supplier profiles?
This article evaluates the current market situation and highlights the key traits that could make a supplier the best fit in the industry.
| Key Highlights |
– Gabriele Bacchini, Sales Manager, Processi Innovativi s.r.l
|
Global Oleochemical Market Facing More Than 30% Overcapacity
The industry is facing 10 years of overcapacity and supply, representing about 2 MMT/year of excess capacity of fatty acids, while fatty alcohols is likely to be experiencing about 1 MMT/year of overcapacity.
Reality behind Overcapacity
- Globally, both fatty acid and alcohol capacities have doubled in the last decade; capacity utilization varies from 80–85% in a well-run competitive plant to <50% in an uncompetitive plant; lower capacity utilization is largely due to spare capacities.
- More than 3 MMT of spare capacity is from South Asia; 15–20% of this spare capacity is from older facilities, which are incompetent to produce in terms of current specifications, quality, and efficiency (i.e., lower tonnage/day).
 Source: ICIS, POC Malaysia, OFI, and Beroe Analysis
The fatty acid market is facing a period of consolidation, and, hence, capacity expansion is expected to be limited until 2020. However, fatty alcohol sector expansion is likely to increase further in the synthetic alcohol segment. Despite the existing overcapacity situation, individual companies are planning expansion, capitalizing their competitive advantage(s) to confront market challenges
Trait 1: Integration across the Value Chain
Major players, such as IOI, KLK, and Musim Mas, are integrated into plantations because
- This helps them utilize excess plantation products, such as palm oil, PKO, and palm stearin, within their shelf life;
- With more revenue from plantations, major players have better margins compared with non-integrated producers; and
- Higher the efficiency ratios, greater is the efficiency in utilizing assets, collecting sales on credit, and better utilization of inventory.
|
Comparison between Suppliers: Based on Integration, Profit, and Financial Stability |
|||
|
Factors |
Financial Ratios |
Suppliers Integrated until Plantation (e.g., IOI, KLK) |
Non-integrated Suppliers (e.g., Jocil) |
|
Profitability Factors |
Revenue Share |
> 45% revenue comes from plantations and the least from oleochemical business |
Nearly, equal revenue comes from oleochemicals and downstream |
| Operating Profit Margin | ≥ 15% (favorable for the buyer) | 7% | |
|
Credit Periods |
Days—Sales Outstanding |
30 days |
45 days (favorable for the buyer) |
|
Efficiency Factors |
Asset Turnover Ratio |
0.75 (favorable for the buyer) |
1.62 |
|
Receivables Turnover Ratio |
12 (favorable for the buyer) |
8 |
|
|
Inventory Turnover Ratio |
5 |
8 (favorable for the buyer) |
|
Source: Financial statements, Bloomberg, Expert interaction, and Beroe Analysis
Buyers’ negotiation power is higher with major suppliers integrated from plantation to oleochemicals compared with non-integrated suppliers due to consistent supply assurance, competitive pricing, and lower risk.
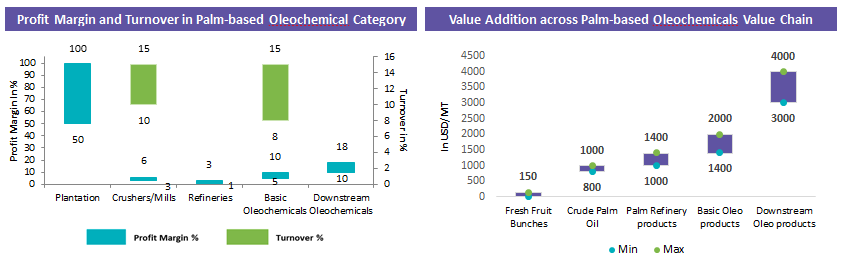
Trait 2: Better Process Economics of Palm-based Products in Natural Oleochemical Segment
Of the global oleochemical produce, 85% are vegetable oil-based because
- Oleochemicals utilize only around 10% of global oils and fats production, but, in turn, add signi?cant value to raw materials;
- Refined, bleached, and deodorized oils add only 8% to the value of crude vegetable oil, while fatty acids add more than 30% value and fatty alcohols, up to 50% value;
- An economic analysis of oleochemicals based on palm stearin in Asia and tallow in the EU and the U.S. computed the average production costs. South East (SE) Asia has the lowest cost of $800–850/MT for stearic acid and $1300–1400/MT for C12–C14 fatty alcohol (SE Asia FOB); and
- Stearic acid production in the EU and the U.S. has better profitability than in SE Asia. However, production is based on tallow, and limited tallow supply and transportation cost increases the total cost of production, and hence, the prices, compared with SE Asia.
Tallow supply is growing only at 1% per annum. Increasing diversion of tallow to biodiesel, palm stearin growing at 3% per annum, and with SE Asia recording cost leadership, it is very likely that future growth will be based on SE Asian palm stearin, not tallow.
Trait 3: Logistical Advantage
Logistics cost has always accounted for a significant (and growing) portion of oleochemical costs. Much of the business has been moving over oceans. Buyers are looking for more ‘exactly-on-time’ deliveries to control inventories. However, countries such as the U.S., Europe, Japan, and even China are facing logistics cost pressure, pushing against oleochemical returns. Thus,
- In SE Asia, oleochemical plants are close to ports to ease exports;
- In India and China, plants are close to ports to facilitate raw material imports; and
- In the U.S., plants are established close to tallow supply, which are inland in the Midwest
| Comparison between Suppliers: Based on Integration, Profit, and Financial Stability | ||
|
Regions |
Countries |
Major Ports (Number of Suppliers with ≥ 0.1 MMT capacity) |
| SE Asia | Indonesia | Medan (4), Dumai (3), Jakarta (2), Sei Mangkei (1), Kisaran (1), and Gresik (1) |
| Malaysia | Pasir Gudang (5), Prai (1), Rawang (1), and Klang (1) | |
| Asia | China | Jiangsu (3), Zhangjiang (2), Tiajin (1), Shandong (1), Zhejiang (1), Rudong (1), Rugao (1), Shanghai (1), Juanxing (1), and Guangdong (1) |
| India | Mundra (1), Valia (1), and Taloja (1) | |
| U.S. |
Plants in Mid-west states: Chicago (1), Ohio (1), Massachusetts (1), and Tennessee (1) |
|
| EU |
Gouda-Netherlands (1), Emmerich-Germany (1), Dusseldorf-Germany (1), Barcelona-Spain (1), and Ertvelde-Belgium (1) |
|
| Middle East | Saudi Arabia | Jubail (1) |
| South America | Brazil | Camacari (1) |
Source: Company statements, Expert interaction, and Beroe Analysis
The U.S. and the EU have better capacity utilization rates compared to Asian countries. However, logistics (both truck and ocean freight), inflate the overall cost. For example, BASF’s fatty alcohol plant in the U.S. was a long way inland. Poor logistics probably could be one of the major reasons for its plant closure (in August 2017), as natural fatty alcohol plants operate by importing raw materials mostly from SE Asia.
Conclusion
- Manufacturers integrated until plantations have better process economics, profitability, and stability against market risks.
- Oleochemical plants in SE Asia with better logistical establishments can manage transportation cost better than in the U.S., EU, or Rest of Asia.
- Buyers can opt for supply partnerships with major integrated manufacturers in SE Asia to ensure consistent supply, quality materials (e.g., lauric oil-based soaps are of superior quality), competitive pricing, and better negotiation leverage.
References
Research/Conference Papers
- Norman Ellard (2018), The Darkest Hour is Before the Dawn, Conference presentation, POC Malaysia Conference 2018
Public Information/Subscriptions
- USDA
- OFI
- ICIS
- Bloomberg
- Factiva
Website References
- Supplier Websites
- Financial Statements


Get more stories like this
Subscirbe for more news,updates and insights from Beroe