Global Mining and Exploration Trends

Abstract
Things are looking up for the exploration sector. The improved investment environment has finally resulted in more dormant companies resuming exploration efforts and new entrants into the industry. The 1,651 companies actively exploring in 2018 is 8 percent more than the 1,535 companies with budgets in 2017. However, the 2018 total is still about 900 companies less than in 2012, representing a one-third culling of active explorers over the past five years.
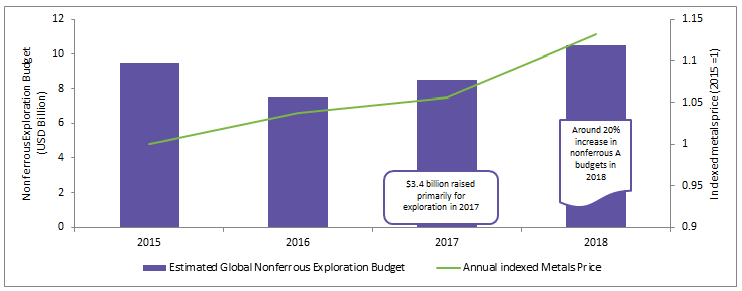
Global spending on the search for nonferrous metals rose to an estimated $8.4 billion in 2017, compared with $7.3 billion in 2016. This represented the first annual increase in exploration spending after four consecutive years of declining investment in the search for nonferrous metals. A preliminary analysis shows that the estimated total annual global nonferrous exploration budget increased for the second time since 2012, rising by almost 20 percent year over year to $10.1 billion from $8.4 billion in 2017.
| Key Highlights |
|
Introduction
Improving market conditions and stronger metals prices since mid-2016 have encouraged many investors to reconsider the mining sector as an investment option. The result has been an uptick in the number and size of completed financings, especially among junior explorers. Although there was a slight pullback in mid-2018, exploration activity remains well above the levels seen prior to the start of the recovery in 2016. It is well known that the junior sector has carried the brunt of the downturn that began in 2012. The surviving juniors continued to make gains in 2018, increasing their aggregate exploration budget by 35 percent year over year. However, the majors continue to account for the majority of planned exploration spending.
Global Nonferrous Exploration Budgets
Improved equity market support for explorers—including many that were dormant during the downturn—allowed companies to launch or resume drill programs on their most promising projects. Although the main focus was on gold, exploration targeting base metal assets also rebounded in the second half of 2018. As a result, our measure of exploration sector activity reached levels not seen since early 2013.
In the last quarter of 2017, there was a sharp increase in reported drill results and financings closed the year on a high note. With the generally positive trend in metal prices in early 2018, that year’s global exploration budget further increased by 15 to 20 percent year over year. There are some potential headwinds, however, such as ongoing instability in global and national politics and emerging market volatility that could have a negative impact—not just on exploration budgets but on the mining sector in general.
Nonferrous Metal Price Trend
Metal prices have benefited from the improved global economy and the recently weaker U.S. dollar, in which most commodities are valued—in January 2018, the dollar’s trade-weighted value was the lowest since December 2014. Although gold prices have been fairly unremarkable since 2017, generally trading within a $100/oz band, gold continues to benefit the most from the industry recovery.
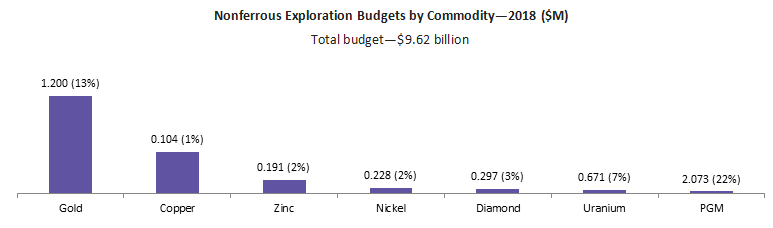
Gold explorers increased their aggregate budget to $4.86 billion in 2018. Although lagging behind the gold allocation total, base metal allocations also made a significant move upward that year, after a fairly tepid 2017, increasing by $606 million to $3.04 billion. Although budgets for all base metals were up substantially, copper had the largest dollar increase, from $369.3 million to $2.07 billion.
Zinc allocations had the largest percentage increase among the base metals, up 37 percent to $671.8 million. Copper and zinc prices had fairly good runs during 2017, which made both metals more appealing to explorers, although their prices have since retreated somewhat.
Aluminum
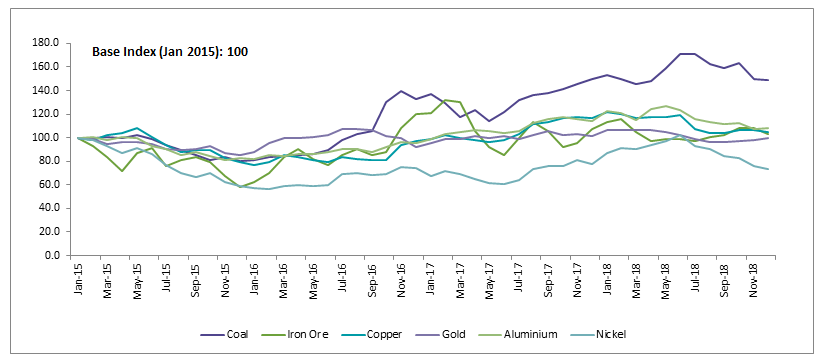
Outlook—Aluminum has continued its bullish run that started in August 2017. If the current bullish sentiment in the metal complex continues, buying organizations can expect more movements to the upside. Based on current market conditions, aluminum prices are expected to average $2,150/mt in 2019.
Drivers—Supply shortage, Russian sanctions, increasing MW premium, gasoline prices, aluminum tariffs
Copper
Outlook—In 2018, copper showed a price weakness. However, the overall trend still suggests a bullish outlook. In 2017, copper prices breached the psychological ceiling of $6,000/mt and have traded above that level. Based on 2018 market conditions, copper prices are expected to average $6,600/mt in 2019.
Drivers—Global copper production, Chinese demand, Chilean mine strikes, Chinese economy, oil prices, U.S. dollar
Nickel
Outlook—Nickel prices continued to rally in 2017 and 2018. The current bull rally for nickel appears sustainable and buying organizations can expect more movements to the upside. Based on current market conditions, nickel prices are expected to average $14,800/mt in 2019.
Drivers—Philippine supply concerns, nickel forecasted deficit, stainless steel demand, Chinese stainless steel probe, U.S. dollar
Iron Ore
Outlook—Iron ore was in for a bit of a ride in 2018—not because of the trade war but because of Chinese environmental regulations, which had miners scrambling to tailor their products to the market.
Drivers—China’s environmental regulations, supplier reduction in production, the Chinese economy, and global trade tensions
Coal
Outlook—During summer 2018, supply concerns helped push prices higher but the price uptick did not last long, with coal trending downward after August on the back of tougher Chinese environmental regulations.
Drivers—China’s environmental regulations, increase in global demand, declining cost of renewable and abundant supply of natural gas
Riskier Exploration Still Unattractive
Over the past few years, industry exploration efforts have been increasingly focused at or near operating mines. A long-term swing away from grassroots exploration has been exacerbated since 2013 by a combination of scarce funding for junior explorers and spending cuts by the majors. Although improved market sentiment from mid-2017 through 2018 seems to have slowed the decline in the grassroots exploration’s share of budgets in 2017, another year of increase in the minesite share reflects the near-term focus of many producers, as well as a persisting climate of risk aversion.
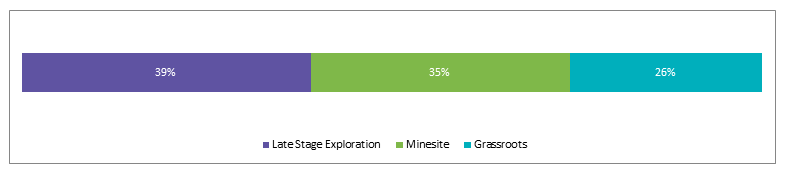
The data for 2018 shows that the late-stage exploration share (39 percent) of the global budget widened the gap with the minesite share (35 percent) and the grassroots share (26 percent).
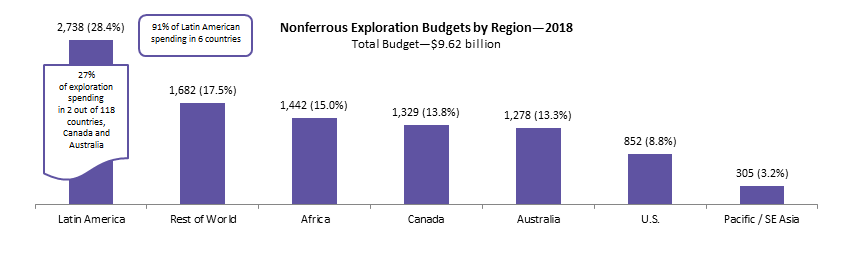
Latin America Remains on Top
Latin America's geological wealth and relative political stability continued to attract the bulk of exploration spending in 2018, with the region's aggregate budget increasing 15 percent year over year to $2.74 billion. The ‘Rest of World’ region, which covers Europe and most of mainland Asia, remains the second most favored region, increasing by 21 percent to $1.68 billion, followed by Canada, Australia, Africa, the U.S. and Pacific/Southeast Asia. Given their size and importance to the industry, Canada, Australia and the U.S. are treated as regions for the purpose of continental-scale comparisons.
Canada, Australia and the U.S. remained the top countries in 2018, with Canada recording a 31 percent year-over-year increase in budgets, the U.S. up 34 percent and Australia up almost 23 percent. Latin American countries accounted for 4 of the top 10 most popular destinations led by Peru, Mexico, and Chile.
Conclusion
Gold led the way to a higher global budget, accounting for 73 percent of the year-over-year increase. The precious metal’s $4.05 billion allocation was 22 percent higher than 2016’s $3.32 billion, increasing its share by 3 percent to account for just over half of the global budget. Base metals (copper, nickel and zinc lead) were collectively a distant second with 30 percent, followed the ‘other targets’ category at 13 percent. Allocations for uranium and diamonds each accounted for around 3 percent and platinum group metals accounted for less than 1 percent.
Since the initial price surge in late 2015, many junior companies have been able to raise funds for lithium-focused exploration or acquisitions. Among all company types, the juniors posted the only lithium budget increase in 2017—a fourfold jump to $128 million, nearly doubling their share of the global lithium exploration budget year over year to 82 percent. The world's largest cobalt producer, the Democratic Republic of the Congo, received one-quarter of the global cobalt exploration budget in 2017.
Recommended Reads:


Get more stories like this
Subscirbe for more news,updates and insights from Beroe