CATEGORY
Collaboration Solutions
Beroe LiVE.Ai™
AI-powered self-service platform for all your sourcing decision needs across 1,200+ categories like Collaboration Solutions.
Market Data, Sourcing & Supplier Intelligence, and Price & Cost Benchmarking.
Schedule a DemoCollaboration Solutions Industry Benchmarks
Savings Achieved
(in %)
The average annual savings achieved in Collaboration Solutions category is 5.72%
Payment Terms
(in days)
The industry average payment terms in Collaboration Solutions category for the current quarter is 82.6 days
Compare your category performance against peers and industry benchmarks across 20+ parameters on Beroe LiVE.Ai™
Category Strategy and Flexibility
Engagement Model
Supply Assurance
Sourcing Process
Supplier Type
Pricing Model
Contract Length
SLAs/KPIs
Lead Time
Supplier Diversity
Targeted Savings
Risk Mitigation
Financial Risk
Sanctions
AMEs
Geopolitical Risk
Cost Optimization
Price per Unit Competitiveness
Specification Leanness
Minimum Order Quality
Payment Terms
Inventory Control
The World’s first Digital Market Analyst
Abi, the AI-powered digital assistant brings together data, insights, and intelligence for faster answers to sourcing questions
Abi is now supercharged with GPT4 AI engine. Enjoy the ease of ChatGPT, now on Abi
Collaboration Solutions Suppliers
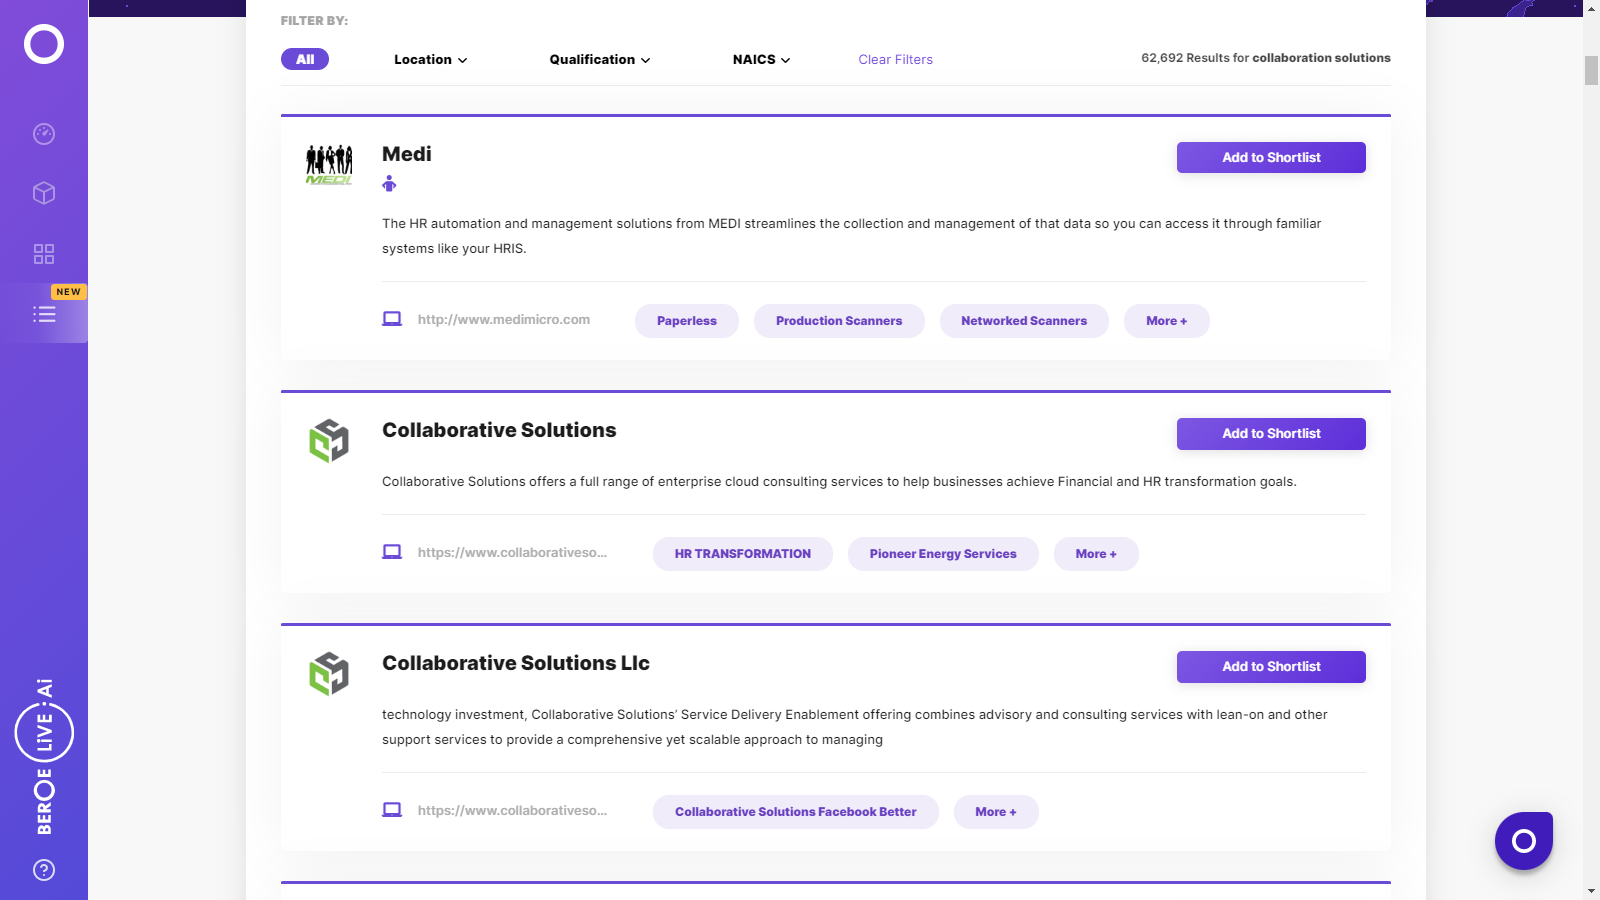
Find the right-fit collaboration solutions supplier for your specific business needs and filter by location, industry, category, revenue, certifications, and more on Beroe LiVE.Ai™.
Schedule a Demo

Use the Collaboration Solutions market, supplier and price information for category strategy creation and Quaterly Business Reviews (QRBs)
Schedule a DemoCollaboration Solutions market report transcript
Collaboration Solutions Global Market Outlook
-
The global market for collaboration software was estimated to be $12.7 billion in 2021 and is expected to grow by a CAGR of 13.2 percent and reach $20.77 billion in 2025
-
The market for cloud-based collaboration software is growing at a CAGR of 14.3 percent, as businesses are transitioning towards digital solutions, focusing on availability and accessibility of information
-
The rise in number of virtual businesses, remote work-from-home and hybrid work scenarios has led to an increase in adoption of collaboration software, the growth of which, had significantly increased during the pandemic
Impact of COVID-19 on Collaboration Solutions Industry
-
The COVID-19 impact on the collaboration solutions was positive, due to a rapid shift of working culture directed towards remote working location. Increase in adoption of cloud-based services during this time surged the demand of digital collaboration, as it was the most preferred choice for the enterprises for its low set up costs and high agility.
-
Largest IT spending in 2022 will be business communication services and it is expected to reach $1.46 trillion with an increase of 1.3 percent compared to 2021.
Global Collaboration Solutions Market: Drivers and Constraints
Industry Drivers
Rapid Increase in Mobile Workforce:
-
Enterprise workforce is increasingly becoming mobile and are working from home or other remote locations. This proportion is expected to comprise more than 45 percent by 2022
-
This mobile workforce will have to communicate with other resource within the enterprise network in-order collaborate and function effectively and efficiently. Unified solutions offer employees multiple tools to communicate and collaborate in real time
Increased Deployment Mobile Devices in the Enterprise:
-
The adoption of mobile devices such as smartphone and tablets, either as BYOD or through corporate owned devices, has been on the rise over the past five years
-
Unified Communication solutions offer enterprise the opportunity to leverage these devices and increase the productivity of the employees
UC as a Service:
- Implementation of Unified Communications as a service will result in the reduction of capital expenses and increase in operational efficiencies
Constraints
Security of the UC Network:
-
Multiple end points from basic VoIP phones to specialized are connected to the enterprise network through the implementation of Unified Communications
-
The increase in the number of end points increases security threats, as confidential data can be exploited from malpractices, such as eaves dropping of the IP network to hacking of specific endpoints
Interoperability Concerns:
- Interoperability issues across various unified communication solutions and systems provided by different vendors has been a deterrent to the implementation Unified Communication solutions
Interesting Reads:
Discover the world of market intelligence and how it can elevate your business strategies.
Learn more about how market intelligence can enable informed decision-making, help identify growth opportunities, manage risks, and shape your business's strategic direction.
Get Ahead with AI-Enabled Market Insights Schedule a Demo Now