Continuous Competitive Advantage

Over the past few years, as organizations have invested in strategic procurement capabilities and increasingly centralized buying decisions, savings have been an acceptable metric to measure procurement performance.
This is because organizations acknowledged that they were starting at a sub-optimal cost level.
This is about to change.
In my conversations with CFO's over the last few months, the most important ask they have of procurement is for performance to be measured "relative to competition" rather than "relative to previous year or budget".
I strongly believe that this is a great opportunity for procurement to step up and shift its role from that of "unpopular cost cutter" to "strategic driver of competitive advantage".
Getting usable, accurate competitive benchmarks at the spend category level is almost impossible. Hence, we at Beroe have come up with a decent proxy metric - A normalized COGS/Revenue ratio.
As you know, COGS stands for the Cost of Goods Sold. We looked at COGS as a % of Revenue. Further, when looking at a set of companies in the same industry, in order to make the numbers comparable, we went through a process of normalization.
Performance in 2011 was set as a baseline of 100 for all of the companies and we looked at 2012-14 in terms of the 2011 baseline to provide trend analysis.
Here are the results from the Packaged Foods industry:
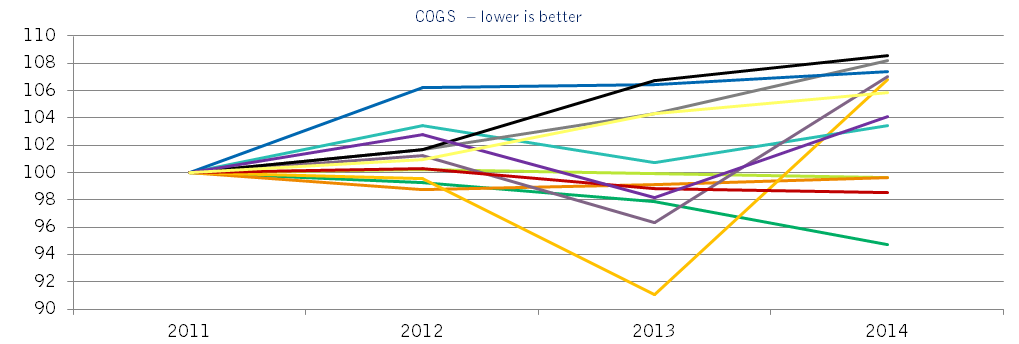
The results are quite striking!
You can see that more than half the companies have a 2014 value that is greater than 100
- This indicates that they are spending more on COGS per $ revenue in 2014 as compared with 2011
- For example, if they spent 40 cents on COGS to generate one dollar of revenue in 2011, they are spending more than 40 cents in 2014
- The worst performer went from 40 cents to 43.4 cents!
Given that all of these companies operated in the same market environment and given that the starting points were normalized (by baselining everyone at 100), these trend-lines should be comparable head to head
As you can see, the delta between the best performer (94.7) and the worst performer (108.6) is 13.9 points - In other words, the best performer has gained a ~14% competitive advantage relative to the worst performer
- This can, of course, be used for R&D investments, predatory pricing, acquisitions etc.
What is even more interesting is that each of the companies above, in their annual reports, declared that their procurement teams had delivered substantial cost reductions, including the worst performer!
Clearly, there is a mismatch in measurements - When there are several companies that are losing cost competitiveness, how can they have delivered "savings"?
The future of procurement depends on making the shift to competition/market based metrics - Success on this scale means that the company has served as a true source of competitive advantage - Helping to move procurement even further away from the perception of being a transactional function.
Your thoughts?


Get more stories like this
Subscirbe for more news,updates and insights from Beroe